<?xml version="1.0" encoding="utf-8"?><feed xmlns="http://www.w3.org/2005/Atom" ><generator uri="https://jekyllrb.com/" version="3.10.0">Jekyll</generator><link href="https://archithsharma.github.io/feed.xml" rel="self" type="application/atom+xml" /><link href="https://archithsharma.github.io/" rel="alternate" type="text/html" /><updated>2026-09-25T13:50:00+00:00</updated><id>https://archithsharma.github.io/feed.xml</id><title type="html">Archith Sharma / Personal Website</title><subtitle>Archith Sharma&apos;s Personal Website, for all professional and personal musings and progress!</subtitle><author><name>Archith Sharma</name><email>archiths@cmu.edu</email></author><entry><title type="html">Could offence be the best defence in football?</title><link href="https://archithsharma.github.io/posts/2026/08/could-offence-be-the-best-defence/" rel="alternate" type="text/html" title="Could offence be the best defence in football?" /><published>2026-08-12T00:00:00+00:00</published><updated>2026-08-12T00:00:00+00:00</updated><id>https://archithsharma.github.io/posts/2026/08/could-offence-be-the-best-defence</id><content type="html" xml:base="https://archithsharma.github.io/posts/2026/08/could-offence-be-the-best-defence/"><![CDATA[<div class="notice--info">
  <p>Originally published on <a href="https://archithsharma.substack.com/p/could-offence-be-the-best-defence">Beyond the Box Score</a> on Substack.</p>
</div>

<p>90 minutes into the match, Japan are desperately trying to keep the Brazilians out. After Japan stole an opening goal, Casemiro pulled the Selecao level. Hajime Moriyasu has made his decision on how to keep it that way - everyone’s at the back. In the 90+6th minute, Gabriel Martinelli then sends a dagger into the heart of the Japanese fans before they can settle the affair in extra time.</p>

<p>About a week after this happened, Thomas Tuchel was down a man, but up a goal against the co-host nation in their fortress, the Azteca. For 30 minutes, Mexico sent cross after cross into the English box, while Dan Burn, John Stones, and Jordan Pickford cleared the ball as quickly as it came in. They escaped the Round of 16 before getting past Erling Haaland and company in the quarters. The introduction of Dan Burn forced Ståle Solbakken to take off his superstar #9 and try to beat England a different way, which they couldn’t.</p>

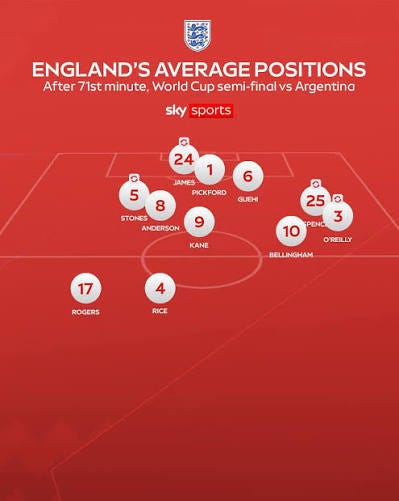
<p>Then came the game against Argentina. After Anthony Gordon’s strike early in the second half, England remarkably had 12% possession for the rest of the match. This wasn’t the most damning statistic, however.</p>

<p><a href="https://substackcdn.com/image/fetch/$s_!A7xq!,f_auto,q_auto:good,fl_progressive:steep/https%3A%2F%2Fsubstack-post-media.s3.amazonaws.com%2Fpublic%2Fimages%2Ffb85a460-8bbb-482a-87e8-e08582f6f82a_399x501.jpeg"><img src="https://substackcdn.com/image/fetch/$s_!A7xq!,w_1456,c_limit,f_auto,q_auto:good,fl_progressive:steep/https%3A%2F%2Fsubstack-post-media.s3.amazonaws.com%2Fpublic%2Fimages%2Ffb85a460-8bbb-482a-87e8-e08582f6f82a_399x501.jpeg" alt="England's 2026 World Cup squad announcement" /></a></p>

<p>Reece James was positioned behind the keeper for an average of over 20 minutes, and Declan Rice was the furthest player up the pitch. While parking the bus suffocated Norway and Mexico, it was the perfect environment for Lionel Messi, and why wouldn’t it be for a passer of his caliber? Just look at the <a href="https://youtu.be/y-4saPWrPt0?si=nn12AWEpeZLaVF9d&amp;t=708">picture-perfect weak-footed cross to Lautaro Martinez to go out in front.</a></p>

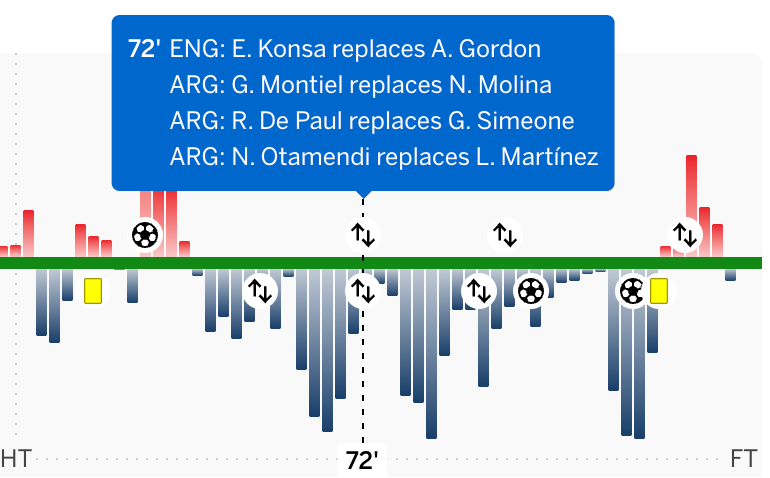
<p>If you ask me, it’s wrong to say Tuchel was at fault for the strategy. Look at the full second-half match momentum chart.</p>

<p><a href="https://substackcdn.com/image/fetch/$s_!jVOR!,f_auto,q_auto:good,fl_progressive:steep/https%3A%2F%2Fsubstack-post-media.s3.amazonaws.com%2Fpublic%2Fimages%2Fc01c2a18-3d32-4814-9d31-7e1f4aa9a0d1_770x478.png"><img src="https://substackcdn.com/image/fetch/$s_!jVOR!,w_1456,c_limit,f_auto,q_auto:good,fl_progressive:steep/https%3A%2F%2Fsubstack-post-media.s3.amazonaws.com%2Fpublic%2Fimages%2Fc01c2a18-3d32-4814-9d31-7e1f4aa9a0d1_770x478.png" alt="Second-half match momentum chart, England vs Argentina" /></a></p>

<p>Even before England’s first substitution, Argentina were pummeling the English, starting at the point Djed Spence unleashed a Maldini-esque tackle on Giuliano Simeone to turn a clear equalizer into a corner. It’s also easy to say that the strategy was wrong after the fact, as hindsight is 20/20. In fact, Argentina’s momentum was significantly reduced over the next few minutes when Dan Burn and Nico O’Reilly were introduced. Then came the Fernandez wonderstrike, and the rest was history.</p>

<p>The question that we should be asking is not whether England should have hunted for a second, but <strong>whether the threat of attacking does a good job of defending.</strong></p>

<p>Thanks for reading! <a href="https://archithsharma.substack.com/subscribe">Subscribe for free on Substack</a> for more data-related insights :)</p>

<p>I know this piece isn’t as detail-oriented as my first one (check it out below!) but I thought it was a question worth exploring given what happened at the World Cup and its ramifications.</p>

<blockquote>
  <p>Earlier post: <a href="/posts/2026/05/for-60-overs-they-should-feel-like/">“For 60 overs, they should feel like hell out there”</a> — how much of India’s 2021 Lord’s turnaround can be credited to Kohli’s captaincy?</p>
</blockquote>

<p>I conducted a quick analysis of games with <a href="https://www.kaggle.com/datasets/gokhanergul/football-match-statistics/data">Gökhan Ergül’s Kaggle Football dataset</a>, although it was not a robust analysis. The general finding is that, on average, teams that play more attacking football tend to preserve leads in club football.</p>

<h2 id="brief-method-description">(Brief) Method Description</h2>

<p>The way that I went about it with this data was to calculate a “defensive” statistic for every team, scaling 4 attributes: the share that the opponent had of possession, SOG, shots, and amount of corners. This isn’t a very robust analysis, but it’s kind of just an exposure to the problem statement anyway so be on the lookout for a better version of this with event data that I’ll be doing later and uploading here!</p>

<p>Note: share is, for any of the four attributes:</p>

\[\text{share} = -\frac{x_{team}}{x_{team} + x_{opp}}\]

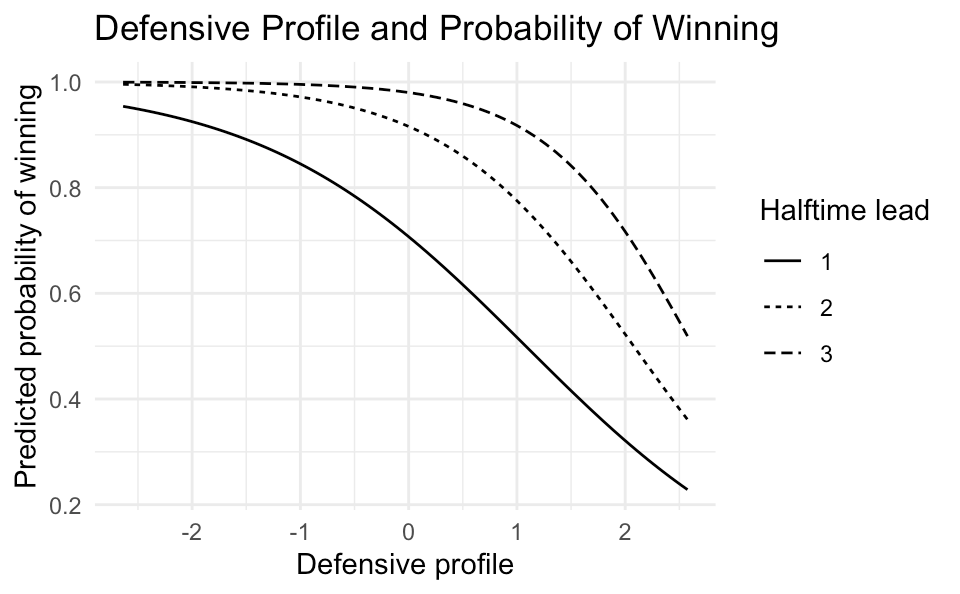
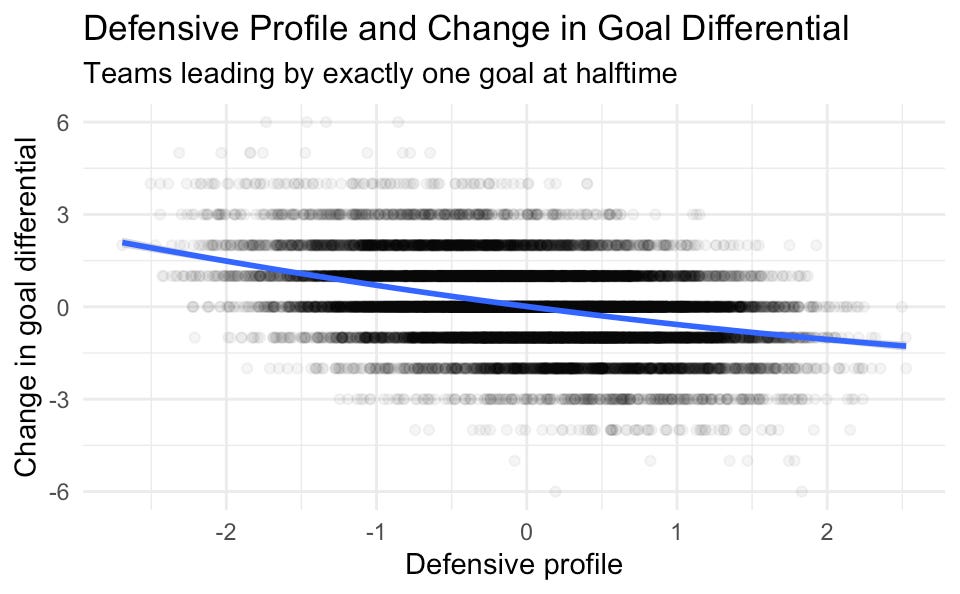
<p>Each of these attributes are then added, with no weighting on them. For each statistic, a higher opponent share corresponds to a higher defensive profile. I standardized the four measures and averaged them with equal weights. Then, I looked at specifically the games with a one-goal halftime differential (or more), to see how this defensive statistic was associated with the probability of preserving a lead conditional on the halftime score.</p>

<h2 id="results">Results</h2>

<p><a href="https://substackcdn.com/image/fetch/$s_!k8ts!,f_auto,q_auto:good,fl_progressive:steep/https%3A%2F%2Fsubstack-post-media.s3.amazonaws.com%2Fpublic%2Fimages%2F7b17981f-b3d2-44d4-831c-88a8f4ee1f5b_960x594.png"><img src="https://substackcdn.com/image/fetch/$s_!k8ts!,w_1456,c_limit,f_auto,q_auto:good,fl_progressive:steep/https%3A%2F%2Fsubstack-post-media.s3.amazonaws.com%2Fpublic%2Fimages%2F7b17981f-b3d2-44d4-831c-88a8f4ee1f5b_960x594.png" alt="Win probability by halftime lead, split by defensive profile" /></a></p>

<p>As you’d expect, win probability increases with the lead regardless of strategy. It’s much easier to give up a one goal lead than a two-goal lead, as Tuchel’s men showed us against Argentina and Mexico. In addition, playing more defensive was mostly correlated to a lower probability of winning, however! This doesn’t necessarily mean that playing defensively makes you more likely to lose; the relationship could instead reflect differences in team quality and other match-level factors.</p>

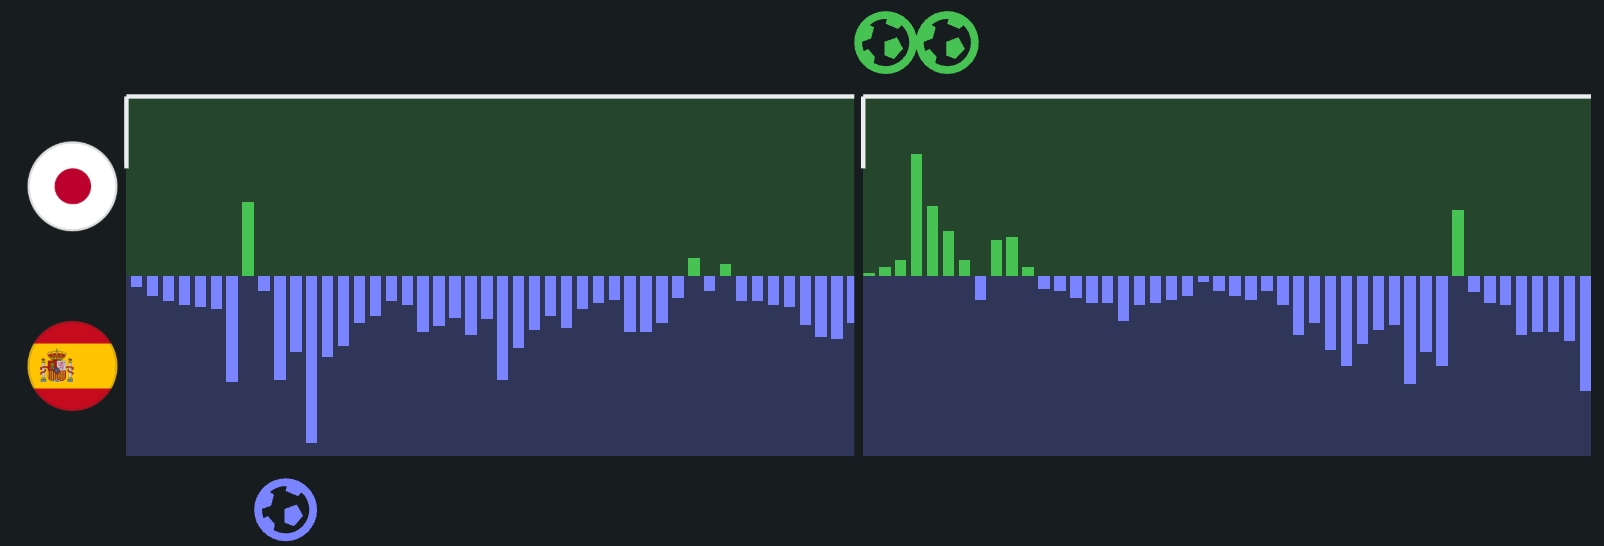
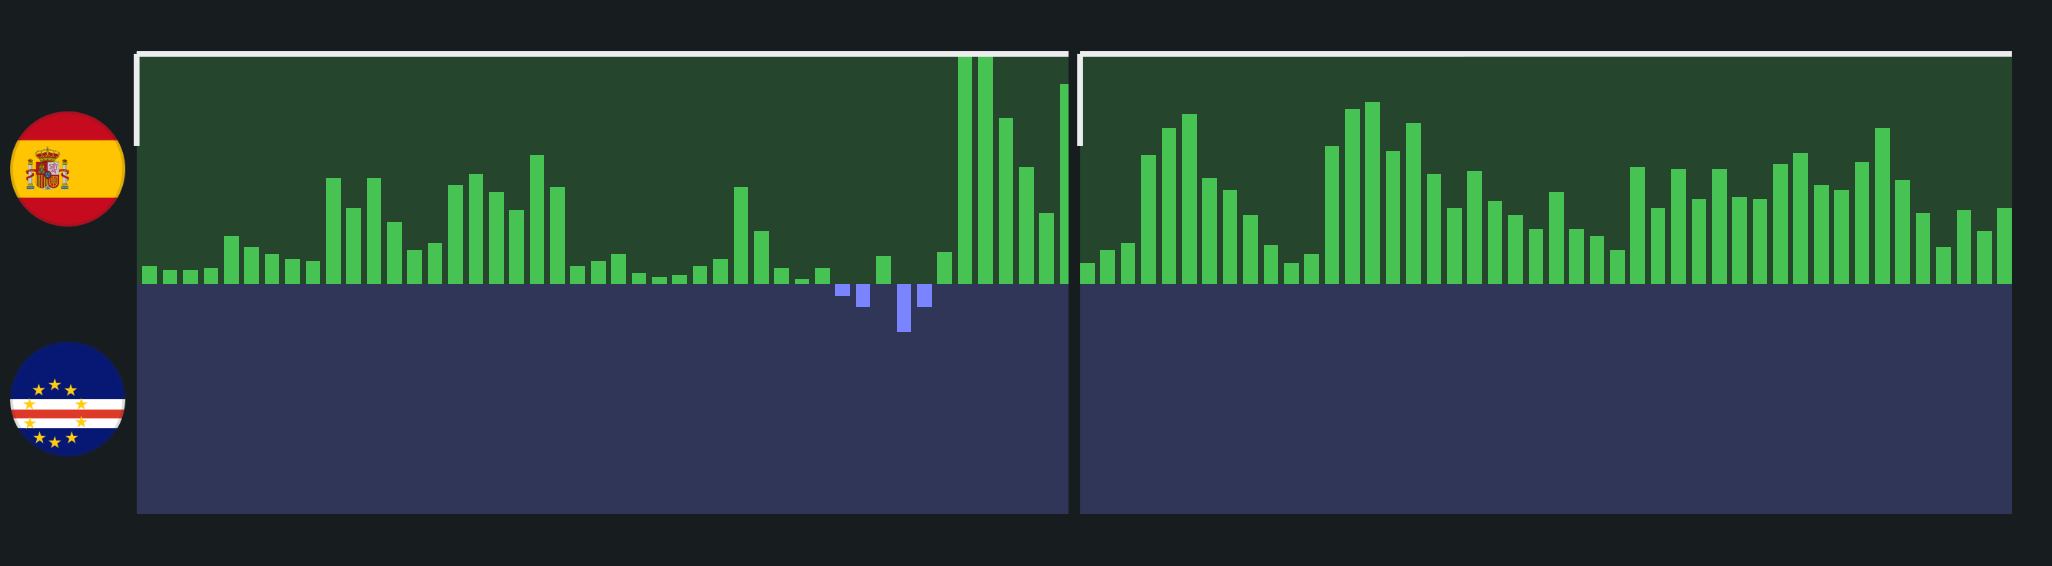
<p>Possession is such a weird statistic in this sense, because most great teams have it, but at the same time, it kind of doesn’t matter. You can pass the ball a thousand times, but be so dull in the final third that 4 minutes is all it takes for your opponent to beat you - just look at the wild momentum sheets from Japan’s match against Spain in 2022, and their momentum sheet from Spain’s opening game against Cabo Verde (via SofaScore). Neither match yielded a favorable result for La Roja.</p>

<p><a href="https://substackcdn.com/image/fetch/$s_!BZa0!,f_auto,q_auto:good,fl_progressive:steep/https%3A%2F%2Fsubstack-post-media.s3.amazonaws.com%2Fpublic%2Fimages%2F9ec163ff-9f14-499f-82ea-6449341e373c_1604x546.png"><img src="https://substackcdn.com/image/fetch/$s_!BZa0!,w_1456,c_limit,f_auto,q_auto:good,fl_progressive:steep/https%3A%2F%2Fsubstack-post-media.s3.amazonaws.com%2Fpublic%2Fimages%2F9ec163ff-9f14-499f-82ea-6449341e373c_1604x546.png" alt="Match momentum chart, Japan vs Spain, 2022 World Cup" /></a></p>

<p><a href="https://substackcdn.com/image/fetch/$s_!ukdv!,f_auto,q_auto:good,fl_progressive:steep/https%3A%2F%2Fsubstack-post-media.s3.amazonaws.com%2Fpublic%2Fimages%2F9a01d4a5-842d-4c76-9bbe-8cea2540b3b8_2052x566.png"><img src="https://substackcdn.com/image/fetch/$s_!ukdv!,w_1456,c_limit,f_auto,q_auto:good,fl_progressive:steep/https%3A%2F%2Fsubstack-post-media.s3.amazonaws.com%2Fpublic%2Fimages%2F9a01d4a5-842d-4c76-9bbe-8cea2540b3b8_2052x566.png" alt="Match momentum chart, Spain vs Cabo Verde, 2026 World Cup" /></a></p>

<p>However, with a very similar style of play, Spain dominated the 2026 World Cup, even though they had an early exit in the 2022 World Cup and had a slow start to the most recent one.</p>

<p><a href="https://substackcdn.com/image/fetch/$s_!5wfu!,f_auto,q_auto:good,fl_progressive:steep/https%3A%2F%2Fsubstack-post-media.s3.amazonaws.com%2Fpublic%2Fimages%2F1610077c-11c4-4e68-a50f-7cab9633506f_960x594.png"><img src="https://substackcdn.com/image/fetch/$s_!5wfu!,w_1456,c_limit,f_auto,q_auto:good,fl_progressive:steep/https%3A%2F%2Fsubstack-post-media.s3.amazonaws.com%2Fpublic%2Fimages%2F1610077c-11c4-4e68-a50f-7cab9633506f_960x594.png" alt="Second-half goal differential against defensive profile" /></a></p>

<blockquote>
  <p>By itself, playing defensively isn’t the reason teams win or lose matches.</p>
</blockquote>

<h2 id="takeaways-i-think-are-important">Takeaways I think are important</h2>

<p>Take a look at this chart. The defensive profile is the x-axis, while the response is goal-differential in the second half. Playing more defensively is correlated with giving up the lead, but part of the reason is simple: when you generate fewer chances yourself, there are fewer opportunities to extend your advantage. The outcome becomes increasingly binary: if the opponent doesn’t score, you survive; if they do, you’re in a real pickle. By itself, playing defensively isn’t the reason teams win or lose matches. The defensive profile explains some variation, but it doesn’t determine the outcome.</p>

<p>There’s obviously comparing execution - Argentina executed very well, England didn’t and there’s luck that plays into that as well. Before Messi’s go-ahead cross, Spence was limping, making Messi’s job of getting the ball to Martinez’s head much easier.</p>

<p>Feel free to share with friends who would also enjoy this content!</p>

<p>The point is, there are plenty of teams that played defensively and came out on top, and plenty of teams that didn’t play defensively and paid for that decision. It just goes to show how difficult the job of a coach is, and how they balance what they can and can’t do while literally the whole world is watching.</p>

<p>Team quality, opponent pressure, execution, and luck all matter. With that being said, there is still merit to the idea that sitting deep can invite pressure, drain energy, and create the conditions for the opponent to eventually find a breakthrough.</p>

<blockquote>
  <p>Perhaps attacking isn’t the opposite of defending. Perhaps threatening the opponent is itself a defensive mechanism.</p>
</blockquote>

<p>Maybe the best way to defend a lead isn’t to stop attacking at all. <strong>Maybe the threat of attacking really is a form of defence.</strong></p>

<p>Hi, I’m Archith! If you love sports and math, you’re in the right place - <a href="https://archithsharma.substack.com/subscribe">subscribe on Substack</a> for more :)</p>]]></content><author><name>Archith Sharma</name><email>archiths@cmu.edu</email></author><category term="football" /><category term="sports analytics" /><category term="World Cup" /><summary type="html"><![CDATA[A review of "parking the bus" at the 2026 World Cup, combined with data on whether attacking teams are better at protecting a lead.]]></summary></entry><entry><title type="html">“For 60 overs, they should feel like hell out there.”</title><link href="https://archithsharma.github.io/posts/2026/05/for-60-overs-they-should-feel-like/" rel="alternate" type="text/html" title="“For 60 overs, they should feel like hell out there.”" /><published>2026-05-12T00:00:00+00:00</published><updated>2026-05-12T00:00:00+00:00</updated><id>https://archithsharma.github.io/posts/2026/05/for-60-overs-they-should-feel-like</id><content type="html" xml:base="https://archithsharma.github.io/posts/2026/05/for-60-overs-they-should-feel-like/"><![CDATA[<div class="notice--info">
  <p>Originally published on <a href="https://archithsharma.substack.com/p/for-60-overs-they-should-feel-like">Beyond the Box Score</a> on Substack.</p>
</div>

<p><a href="https://substackcdn.com/image/fetch/$s_!9m64!,f_auto,q_auto:good,fl_progressive:steep/https%3A%2F%2Fsubstack-post-media.s3.amazonaws.com%2Fpublic%2Fimages%2F75cce95f-1814-47e8-a81b-a0d2b3542129_680x383.jpeg"><img src="https://substackcdn.com/image/fetch/$s_!9m64!,w_1456,c_limit,f_auto,q_auto:good,fl_progressive:steep/https%3A%2F%2Fsubstack-post-media.s3.amazonaws.com%2Fpublic%2Fimages%2F75cce95f-1814-47e8-a81b-a0d2b3542129_680x383.jpeg" alt="Kohli's team talk before the fourth innings at Lord's, 2021" /></a></p>

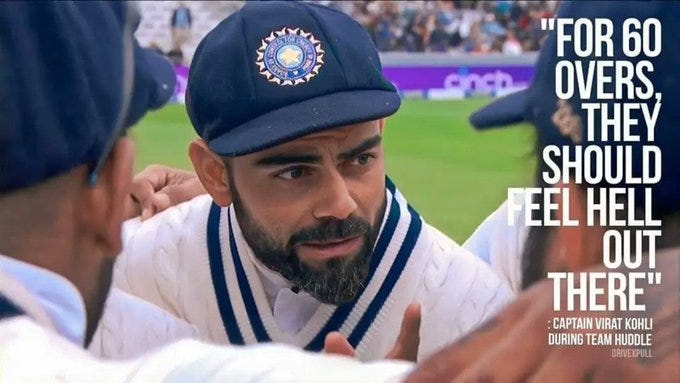
<p>Avid fans of the Indian Test team will be quick to point out that this quote comes from Virat Kohli, as he and his men took the field for the fourth innings after a declaration in the 2021 Test at Lord’s between India and England. What happened next was shocking; one of the largest single-day turnarounds in the last 50 years of Test cricket followed.</p>

<p>England were rattled 120 all out with Siraj and Bumrah picking up 7 wickets between them. However, the focus point when one brings up this match shifts between KL Rahul’s 129, Shami and Bumrah’s unlikely 89-run partnership, and the fourth-innings effort that is often brought up with Kohli’s name.</p>

<p>Despite not bowling a single ball and scoring a measly 11% of his team’s runs batting at #4, this match is brought up as Kohli’s crowning achievement as captain of the Indian Test side. As an analytical mind, the natural next step was to wonder: “How much of this can actually be attributed to Kohli? How can we quantify it?”</p>

<p>I attempt to explore the question of the effect of captaincy in Test cricket as best I can with the help of <a href="https://himanishganjoo.com/cricket-data/">Himanish Ganjoo’s</a> Ball-by-Ball dataset with line/length, <a href="https://bhuvaneshprasad.dev/">Bhuvanesh Prasad’s</a> Test match dataset, and Cricinfo data. <!-- TODO: the original credits two Substack authors by @mention (lost in the markdown export). Add their names/links here. --> If you enjoyed it, <a href="https://archithsharma.substack.com/subscribe">subscribe on Substack</a> and share my work with your friends! :)</p>

<hr />

<h2 id="data-overview">Data Overview</h2>

<p>The data comes from 3 sources. The ball-by-ball data contains line/length, country, and game state features (bat runs/balls faced, bowler wickets/balls faced, innings, innings runs/overs, day, session, bat hand, bowl style). Cricinfo’s data includes innings-by-innings records for all players, which can be joined to infer player quality/form. The match dataset includes information on who the captain is for all matches from January 1, 2005, to May 2024, which is the time period of analysis for this dataset.</p>

<h2 id="feature-preparation">Feature Preparation</h2>

<p>The idea behind the feature engineering is that we want to see the current game state and adjust for the quality of the players and the current match context, i.e., “What is the captain looking at right now, and what did he do beyond what was already in front of him?” We don’t want a captain rewarded for having Mitchell Starc and punished for a subpar attack. This is where line/length comes in, as, along with bowler/batting quality proxies, we can estimate the expected outcome of each ball. With the game state and information about the ball, the match residual can be used to estimate the persistent impact that a captain has on the game over the course of their captaincy.</p>

<p>From the Cricinfo data, a Bayesian prior is calculated for each player’s average and strike rate before the match to estimate player strength. Note for bowling, the strike rate is the average number of balls it takes to get a wicket, while for batting, it’s simply 100 * runs/balls. <strong>They are different statistics</strong>. For batting and bowling averages, the same formula is used:</p>

<p><!-- TODO: paste the formula here as $$...$$ --></p>

\[Avg_{post} = \frac{k * \mu_{average} + R}
      {(k + W)}\]

<p>Where <em>W</em> is the amount of dismissals/wickets for a bowler, and <em>R</em> is the runs before a match. <em>Mu</em> is the population average for that statistic during the corresponding calendar year. The more we learn about a player, the more the prior converges to the true average. For batting and bowling strike rate, where <em>B</em> is the amount of balls a batsman faces or a bowler has bowled before a match:</p>

<p><!-- TODO: paste the formula here as $$...$$ --></p>

\[Batsr_{post} = \frac{k * \mu_{batsr} + 100 * R}{k + B}\]

\[Bowlsr_{post} = \frac{k * \mu_{bowlsr} + R}{k + B}\]

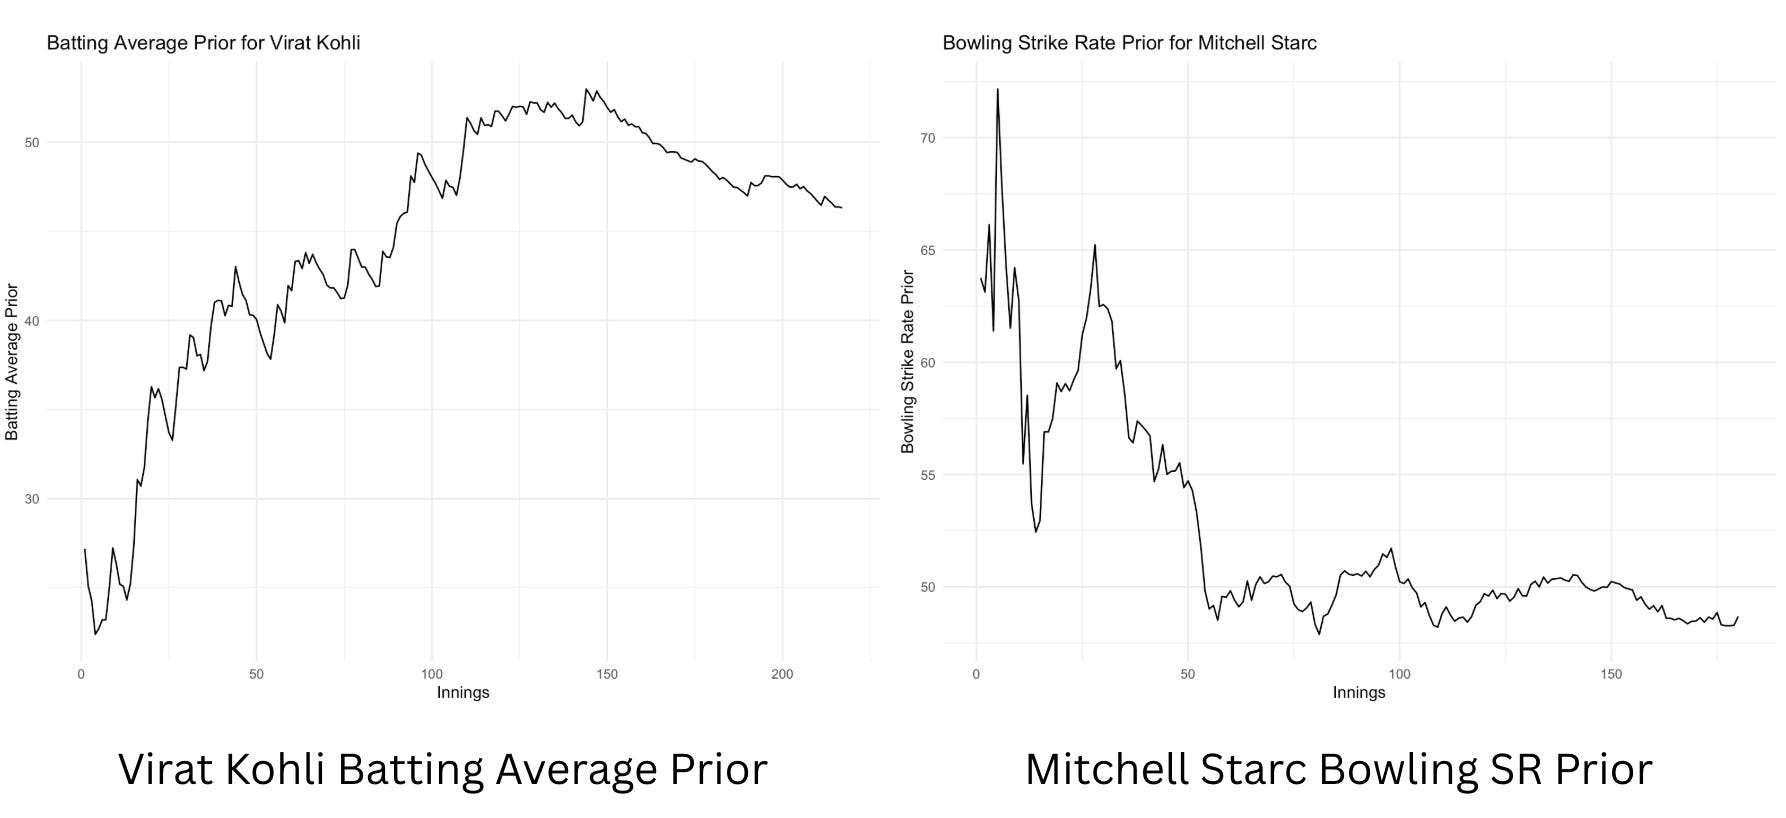
<p>In the examples of Virat Kohli’s batting average and Mitchell Starc’s bowling strike rate, you can see the averages fluctuate early in their careers, but as they become more established players, the priors become consistent with their career averages to that point. Experience is also treated as a feature, shared as a log transformed value of the number of innings a player batted/bowled in.</p>

<p><a href="https://substackcdn.com/image/fetch/$s_!9WkL!,f_auto,q_auto:good,fl_progressive:steep/https%3A%2F%2Fsubstack-post-media.s3.amazonaws.com%2Fpublic%2Fimages%2F27f56e4b-c95e-49b2-8e7e-61c3b131cacc_1786x818.png"><img src="https://substackcdn.com/image/fetch/$s_!9WkL!,w_1456,c_limit,f_auto,q_auto:good,fl_progressive:steep/https%3A%2F%2Fsubstack-post-media.s3.amazonaws.com%2Fpublic%2Fimages%2F27f56e4b-c95e-49b2-8e7e-61c3b131cacc_1786x818.png" alt="Bayesian-prior batting average for Virat Kohli and bowling strike rate for Mitchell Starc over their careers" /></a></p>

<h2 id="expected-runswickets-models">Expected Runs/Wickets Models</h2>

<p>To model expected runs and wickets, two separate XGBoost models are trained on all the features. Runs are treated as discrete outcomes and in classes - 2s and 3s were one class, and the small number of 5s were placed into 1s class as they come from overthrows on a single. Both models were trained for 200 boosting rounds using the full set of encoded predictors derived from the engineered features.</p>

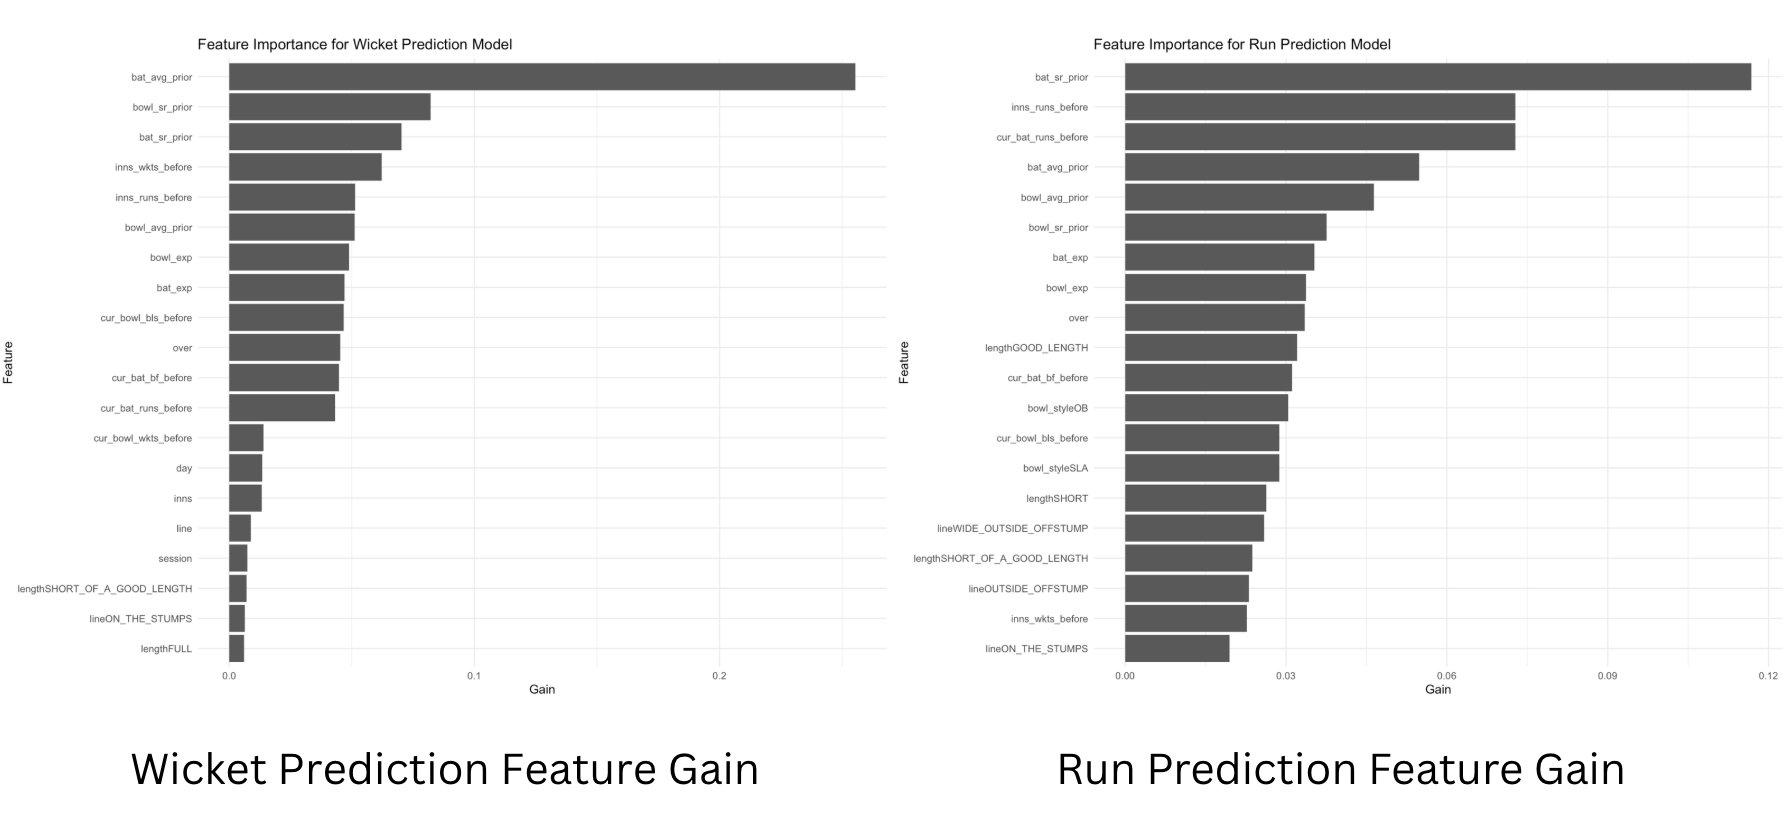
<p>The feature importance plots are shown, with some interesting takeaways. The batting average and bowler quality are the most important features, as well as the innings state - the model recognizes that wicket probability changes as batsmen keep going, or as one gets into the tail. Moderate gain is also present in the amount of balls a batsman/bowler have been involved in.</p>

<p>In the expected runs model, line/length are much more important (for example, the gain in the outside off-stump line is most likely due to players leaving). Batting strike rate is expected to be the most important feature, as it quantifies the batter’s aggressiveness. In addition, as an inning progresses, the model recognizes batsmen are looking to score more. Player experience is also much more of a factor in this model, likely because experienced players know how to plan when going for/restricting runs to balance run-scoring/prevention with wicket taking/protection.</p>

<p><a href="https://substackcdn.com/image/fetch/$s_!iheB!,f_auto,q_auto:good,fl_progressive:steep/https%3A%2F%2Fsubstack-post-media.s3.amazonaws.com%2Fpublic%2Fimages%2F406cc549-3812-4ce0-bab0-355571b299a0_1786x818.png"><img src="https://substackcdn.com/image/fetch/$s_!iheB!,w_1456,c_limit,f_auto,q_auto:good,fl_progressive:steep/https%3A%2F%2Fsubstack-post-media.s3.amazonaws.com%2Fpublic%2Fimages%2F406cc549-3812-4ce0-bab0-355571b299a0_1786x818.png" alt="Feature importance for the expected wickets and expected runs models" /></a></p>

<h2 id="empirical-bayesian-shrinkage-of-residuals">Empirical Bayesian Shrinkage of Residuals</h2>

<p>Once expected runs and wickets are available, to analyze the persistent effects of captains, empirical Bayesian shrinkage is used. For wickets and runs, an empirical Bayes shrinkage estimator was applied directly to each captain’s average match residual as a linear mixed-effects model estimated essentially zero between-captain variance. This means the units of each effect are easily interpretable - wickets taken above/below average and the same for runs conceded.</p>

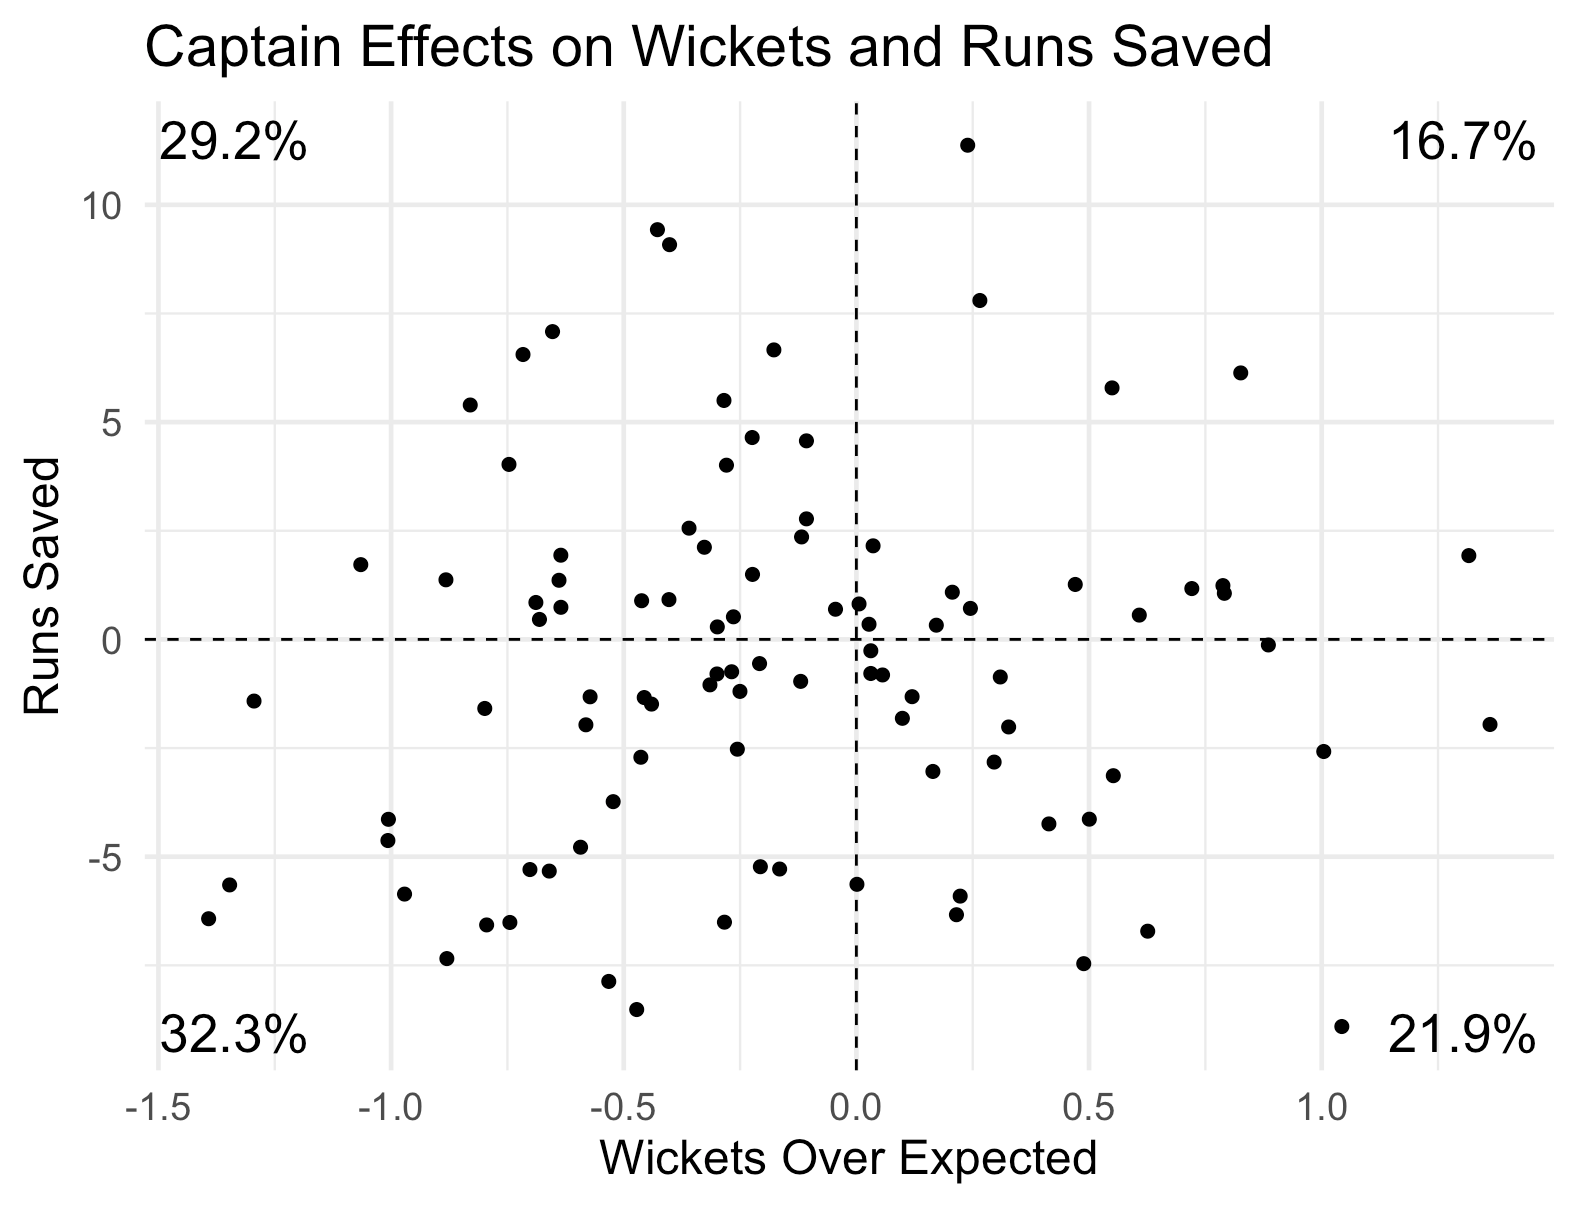
<p>It’s important to note that in a game-planning sense, captains are trying to take wickets and ~33 runs are worth one wicket in Test cricket, so captains are willing to let 10 runs go if it means it’ll increase the chances of getting a wicket. This planning, especially at the top order, is an ever-changing optimization problem that captains have to deal with. If a captain can take wickets while balancing the amount of runs they let go, then their ability is truly exceptional. The effect of this balance is that you have a residual estimate of each captain’s ability in both facets that looks like this:</p>

<p><a href="https://substackcdn.com/image/fetch/$s_!l8-8!,f_auto,q_auto:good,fl_progressive:steep/https%3A%2F%2Fsubstack-post-media.s3.amazonaws.com%2Fpublic%2Fimages%2F95e13954-bcad-4235-bded-c2ac20c8aa0f_1578x1208.png"><img src="https://substackcdn.com/image/fetch/$s_!l8-8!,w_1456,c_limit,f_auto,q_auto:good,fl_progressive:steep/https%3A%2F%2Fsubstack-post-media.s3.amazonaws.com%2Fpublic%2Fimages%2F95e13954-bcad-4235-bded-c2ac20c8aa0f_1578x1208.png" alt="Captains' persistent effects on wickets and runs conceded" /></a></p>

<p>The estimates here are the persistent effect that a captain has on wickets taken and runs conceded beyond what would be expected given the match context and the quality of the players involved. What pops out is that top-right quadrant is where most captains want to be - conceding less runs and taking more wickets than average, but only 16.7% of captains end up in that quadrant. Almost 2/3rds of the captains also have a negative wicket effect, meaning they consistently took fewer wickets than the model expected.</p>

<p>There also is little to no association with these effect sizes and the amount of matches captained. There is weak evidence that more experienced captains tend to save slightly more runs than expected (r2 = 5.6%), while there is no clear evidence that simply captaining more matches leads to better-than-expected wicket taking (r2 = 3%), with n = 96.</p>

<p>I also wanted to address one of the points on the left of the scatterplot, as it happens to be Graeme Smith with a wicket effect of -0.63. Obviously, he was not a bad captain by any stretch of the imagination; the South African team was fearsome with Steyn, Morkel, Philander, and Kallis, but that’s just it. Smith’s slightly negative residual indicates that, relative to the already high expectations set by his bowling attack, his teams took marginally fewer wickets than predicted. In other words, the model is evaluating performance relative to the strength of the bowling attack, not absolute wicket totals.</p>

<p>Coming back to the Lord’s 2021 example: there were 6.69 expected wickets in the fourth innings, meaning ~3.3 wickets were taken over expected, which is a lot. In all 4th innings in the data, 3.31 is in the top 8.6% of wickets over expected. The empirical Bayes model allows us to assign roughly a quarter of this residual to Kohli’s estimated captain effect. Across many matches, Kohli’s teams consistently outperform their expected wicket totals after accounting for player quality and match context, providing evidence of a persistent captaincy effect - this match is just one point of evidence.</p>

<h2 id="top-captain-ratings-the-interesting-part">Top captain ratings, the interesting part…</h2>

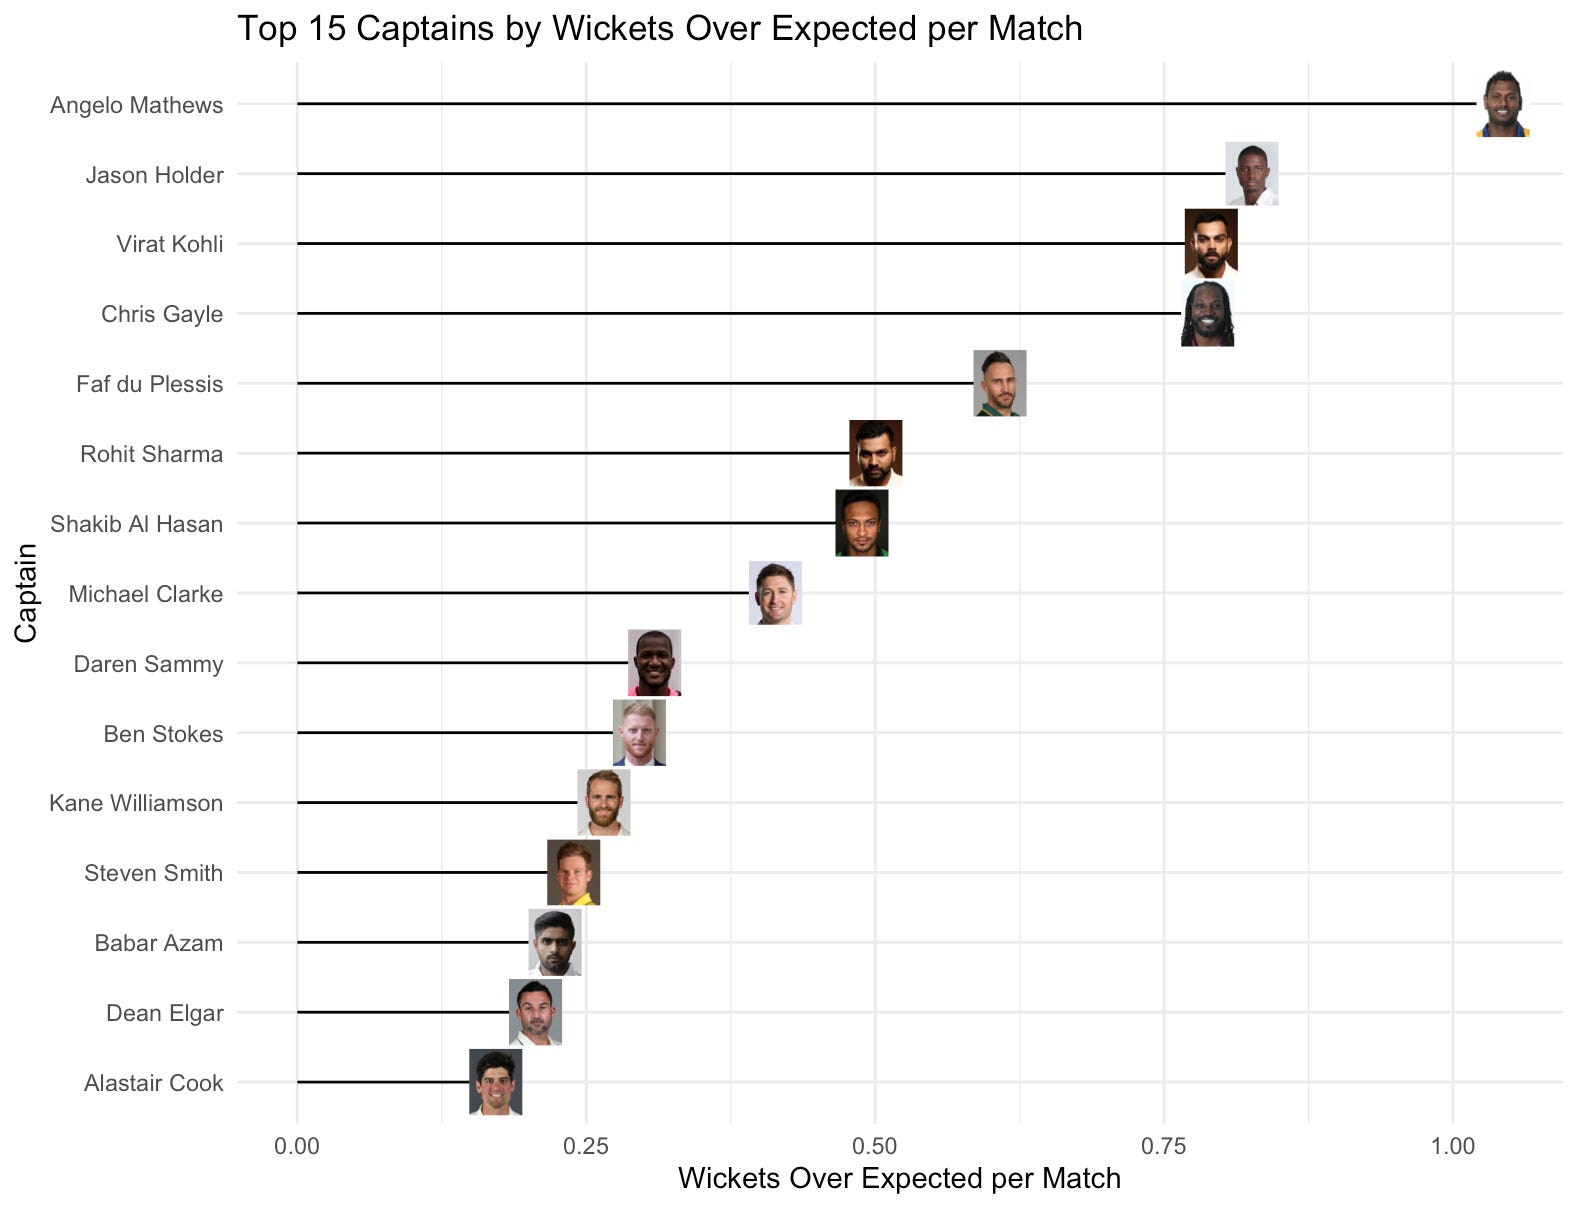
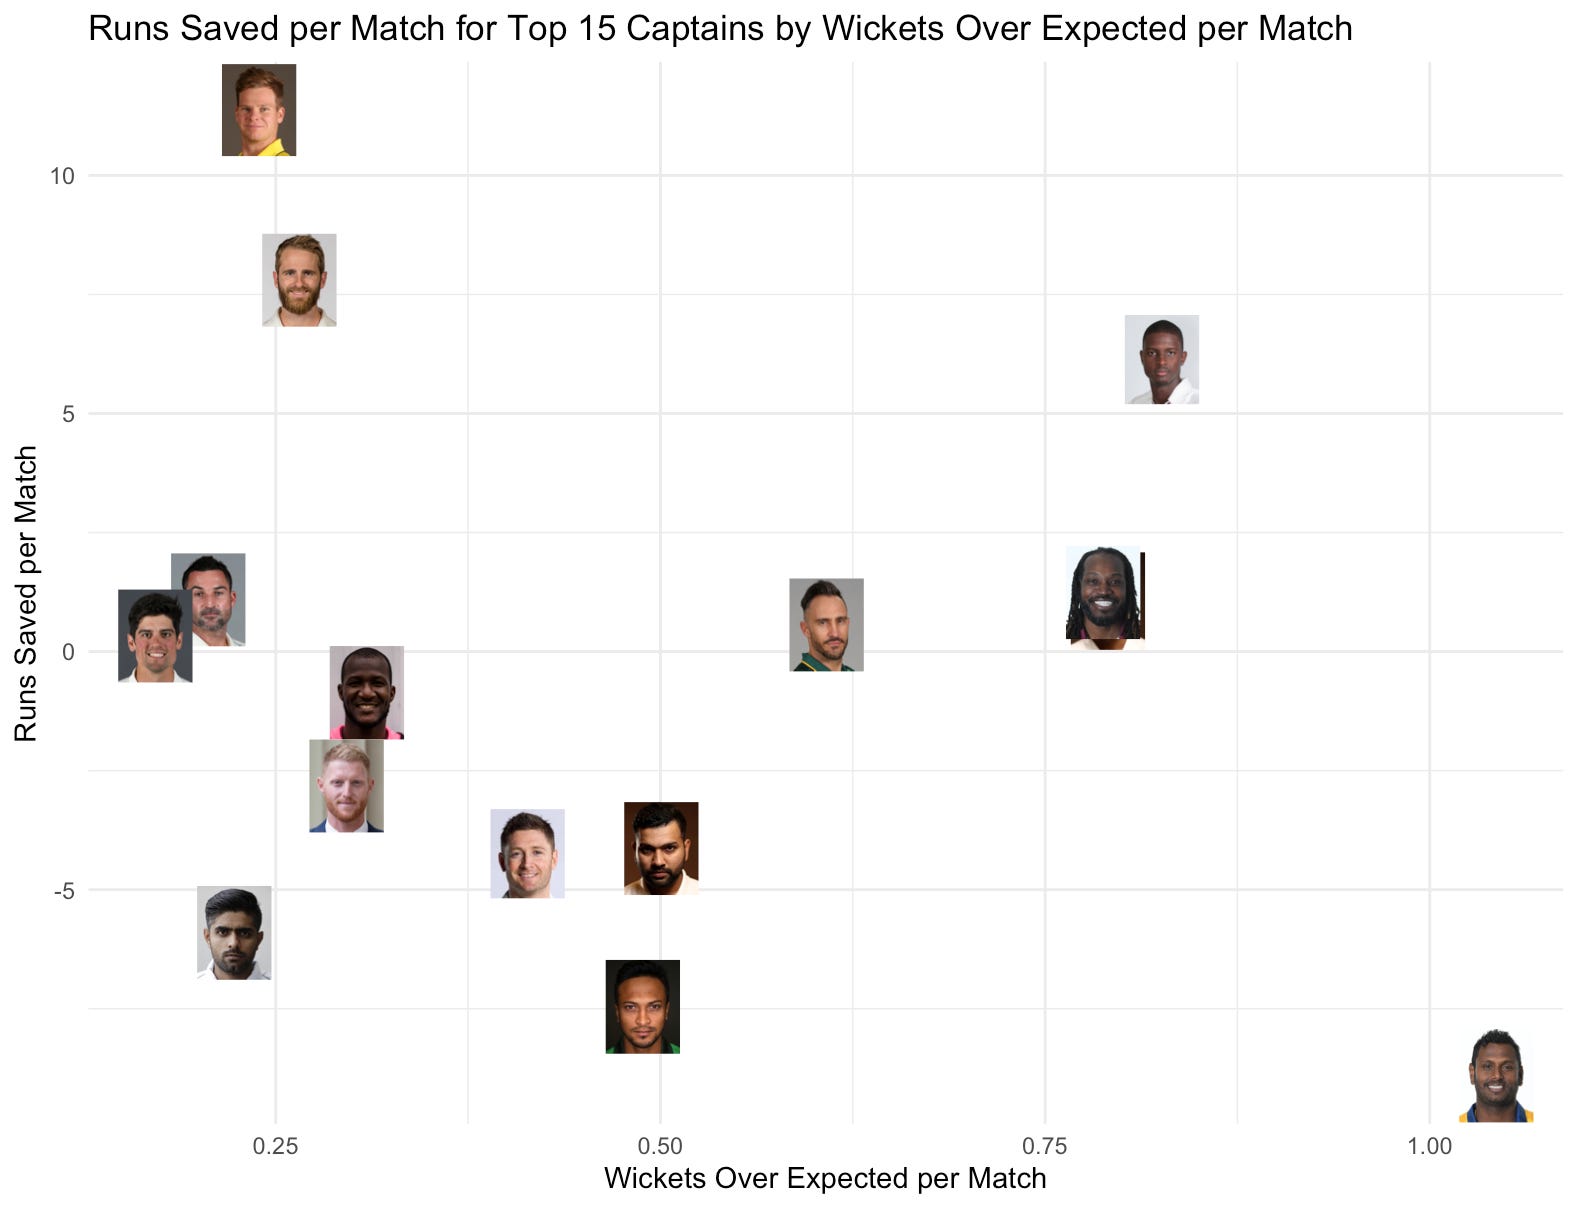
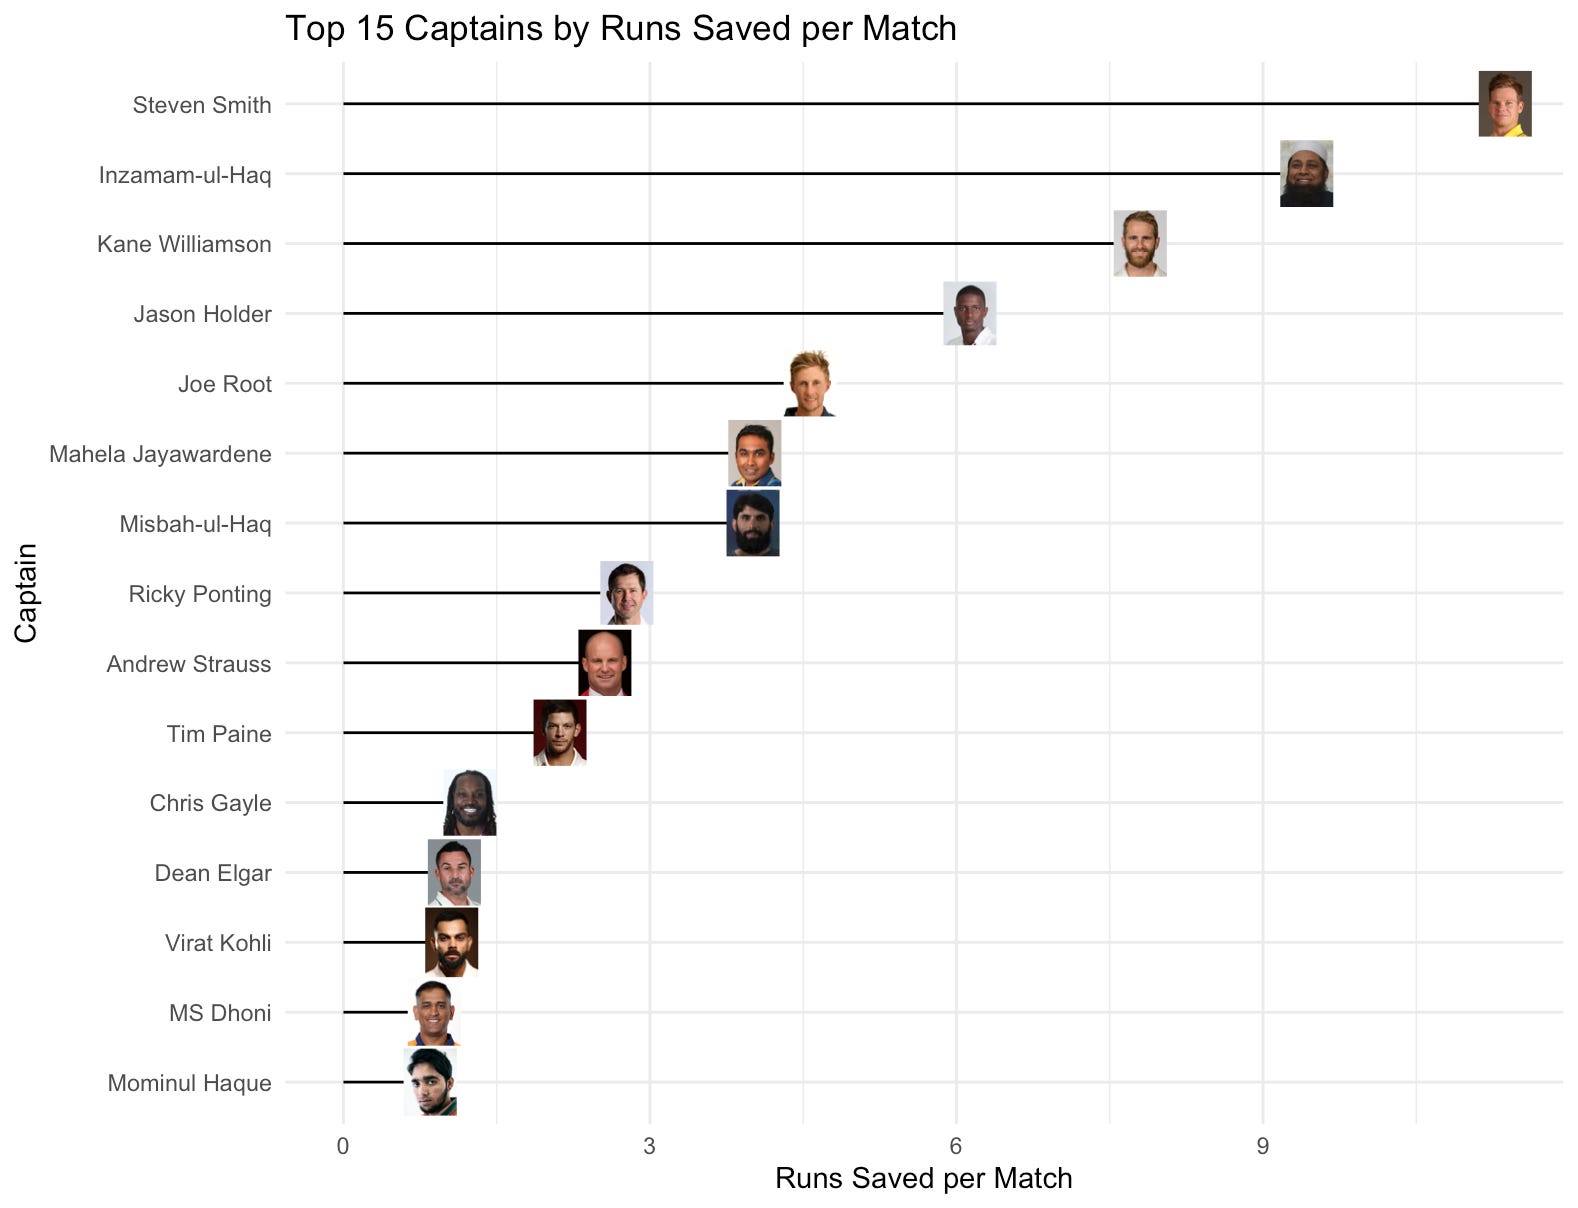
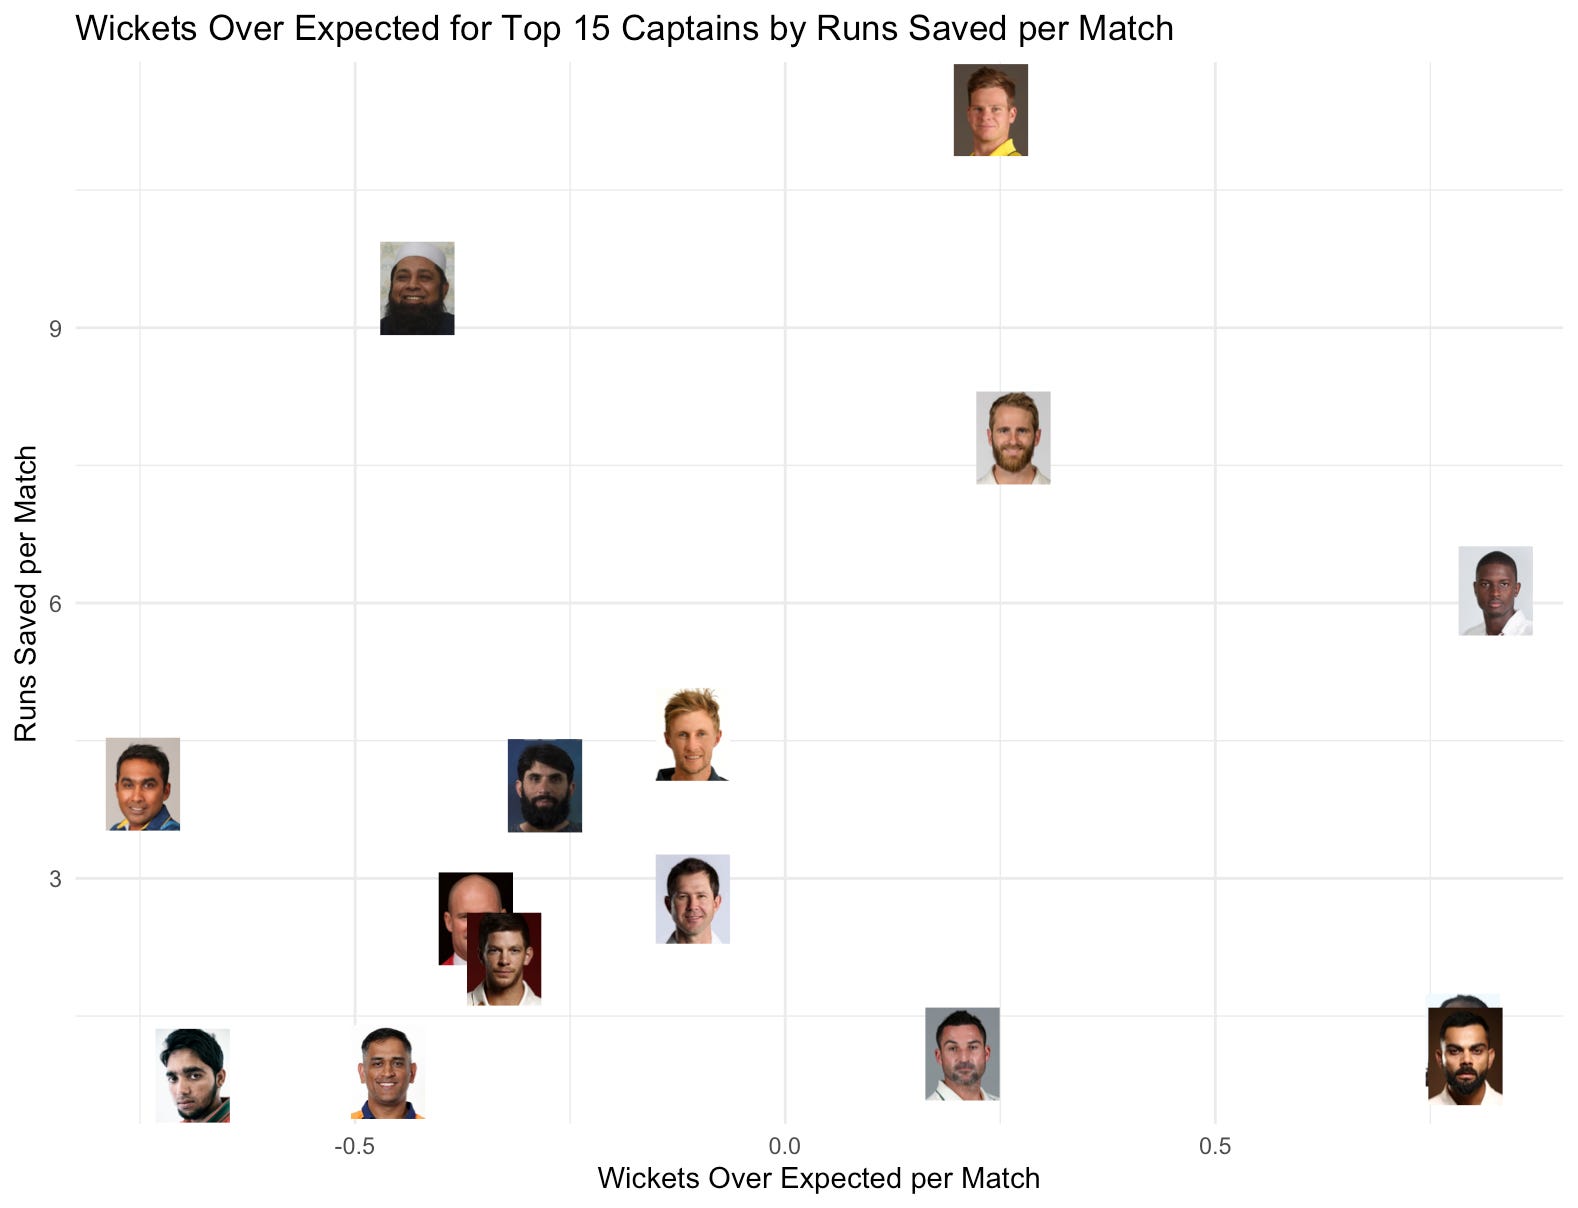
<p>Lastly, I wanted to leave you with the top 15 captains by their wicket/run effects. The plot of their wicket effect is shown, as well as their corresponding run effect, and vice versa. I could address specific captains, but I think it would be more fun to hear what you think of the top captains in the comments!</p>

<p>The one I will address is Jason Holder - for the squads he was given, he was able to extract consistent effects in runs and wickets. He lost his captaincy due to some <a href="https://www.espncricinfo.com/story/jason-holder-on-losing-test-captaincy-it-has-been-a-strange-transition-1265647">politics with the WICB</a> after missing one series due to COVID concerns, which obviously this model doesn’t take into account ;) Quantitatively, Holder is one of the best captains in the last 20 years while his replacement Kraigg Brathwaite doesn’t come close.</p>

<p><a href="https://substackcdn.com/image/fetch/$s_!Dg6s!,f_auto,q_auto:good,fl_progressive:steep/https%3A%2F%2Fsubstack-post-media.s3.amazonaws.com%2Fpublic%2Fimages%2Fa8c33776-b3d5-4db1-b19c-e8fce43f1a86_1578x1208.png"><img src="https://substackcdn.com/image/fetch/$s_!Dg6s!,w_1456,c_limit,f_auto,q_auto:good,fl_progressive:steep/https%3A%2F%2Fsubstack-post-media.s3.amazonaws.com%2Fpublic%2Fimages%2Fa8c33776-b3d5-4db1-b19c-e8fce43f1a86_1578x1208.png" alt="Top captains by wicket effect and run effect (1 of 4)" /></a></p>

<p><a href="https://substackcdn.com/image/fetch/$s_!7RY0!,f_auto,q_auto:good,fl_progressive:steep/https%3A%2F%2Fsubstack-post-media.s3.amazonaws.com%2Fpublic%2Fimages%2F91c7aeba-7274-4b59-aacc-fc27f9412715_1578x1208.png"><img src="https://substackcdn.com/image/fetch/$s_!7RY0!,w_1456,c_limit,f_auto,q_auto:good,fl_progressive:steep/https%3A%2F%2Fsubstack-post-media.s3.amazonaws.com%2Fpublic%2Fimages%2F91c7aeba-7274-4b59-aacc-fc27f9412715_1578x1208.png" alt="Top captains by wicket effect and run effect (2 of 4)" /></a></p>

<p><a href="https://substackcdn.com/image/fetch/$s_!yckA!,f_auto,q_auto:good,fl_progressive:steep/https%3A%2F%2Fsubstack-post-media.s3.amazonaws.com%2Fpublic%2Fimages%2F10ac1fac-16e0-49fe-b6e6-3f5ededad257_1578x1208.png"><img src="https://substackcdn.com/image/fetch/$s_!yckA!,w_1456,c_limit,f_auto,q_auto:good,fl_progressive:steep/https%3A%2F%2Fsubstack-post-media.s3.amazonaws.com%2Fpublic%2Fimages%2F10ac1fac-16e0-49fe-b6e6-3f5ededad257_1578x1208.png" alt="Top captains by wicket effect and run effect (3 of 4)" /></a></p>

<p><a href="https://substackcdn.com/image/fetch/$s_!2fvm!,f_auto,q_auto:good,fl_progressive:steep/https%3A%2F%2Fsubstack-post-media.s3.amazonaws.com%2Fpublic%2Fimages%2F765e78e3-7097-4c69-806f-060efe0665ca_1578x1208.png"><img src="https://substackcdn.com/image/fetch/$s_!2fvm!,w_1456,c_limit,f_auto,q_auto:good,fl_progressive:steep/https%3A%2F%2Fsubstack-post-media.s3.amazonaws.com%2Fpublic%2Fimages%2F765e78e3-7097-4c69-806f-060efe0665ca_1578x1208.png" alt="Top captains by wicket effect and run effect (4 of 4)" /></a></p>

<h2 id="whats-missing--thanks-for-reading">What’s missing + Thanks for reading!</h2>

<p>This doesn’t take into account any impact of a captain’s DRS accuracy or other decisions like declaration timing - in that same England vs. India match, Kohli got two not-outs for LBW overturned, getting Bairstow pad-first and ending Robinson’s resistance with the rest of the wickets falling shortly after. In addition, he declared 9 balls into the second session, not at lunch, which did not allow the batters the hour to prepare for the first ball. Partly due to that, both openers fell within the first two overs. This is consistent with the model estimating a strong positive residual in that innings, although it should only be treated as an illustrative example rather than direct evidence of a 3.3-wicket captaincy effect.</p>

<p>In addition, off-the field issues, heavy scrutiny in the public eye, and selection politics come with the Test captaincy, especially in India, Australia, and England. I mentioned Jason Holder’s situation despite his excellence as skipper and overall maturity even as a younger captain. Recently, Ben Stokes has resigned his captaincy post and even retired from international cricket following a <a href="https://www.cricketnews.com/en/cricket/news/what-happened-ben-stokes-nightclub-timeline-england-captain-controversy/58551283816f3c8dc94a9d99">nightclub incident </a>with Gus Atkinson and a rugby team. As recent events have shown, there’s a lot more than what happens on the field that goes into becoming and maintaining Test captain. There is also the issue of captaincy hampering individual performance, as for example, Virat Kohli’s batting average in Tests dipped near the end of his captaincy and continued to decline until 2024 when he retired from the format.</p>

<p>Speaking of Virat Kohli: his wicket effect of 0.79 is an average estimate based on all the data available - it’s much more robust and is built upon years of data. He may have been partially responsible for 3 wickets in one match, and been the reason India didn’t take 2 in the next. India may have had a hundred problems as the variation between matches shows, but captaincy wasn’t one of them with Kohli. For him, as well as the other Test captains in the data, it has a small effect on average, but it adds up over time and very well may have been the difference in many games with similar quality on both sides. Hope you enjoyed reading!</p>

<p>Hi I’m Archith! <a href="https://archithsharma.substack.com/subscribe">Subscribe on Substack</a> if you love sports and numbers, you’ve made it this far :)</p>]]></content><author><name>Archith Sharma</name><email>archiths@cmu.edu</email></author><category term="cricket" /><category term="sports analytics" /><category term="Test cricket" /><summary type="html"><![CDATA[How much of India’s 2021 Lord’s turnaround can actually be attributed to Kohli’s captaincy? Expected runs/wickets models plus empirical Bayes shrinkage estimate the persistent effect of Test captains.]]></summary></entry></feed>