2 Creating Player Rankings - Player_Rankings.R
2.1 Summarize Impact by Player
Join batting and bowling data for player rankings
Player Rankings based on Batting and Bowling ratings without making separate players one for batting and bowling
player_rankings <- player_data %>%
  group_by(Player, Country) %>%
  summarise(
    CareerBatImpact = sum(BattingImpact, na.rm = TRUE),
    CareerBowlImpact = sum(BowlingImpact, na.rm = TRUE),
    MatchesPlayed = n()
  ) %>%
  mutate(TotalImpact = CareerBatImpact + CareerBowlImpact) %>%
  arrange(desc(TotalImpact))
Join player batting bowling data
Loop through the player rankings unique elements and get the higher of their bat bowl impacts to use in new dataframe
for (player in unique(player_rankings$Player)){
  #if quote at the end of player name string, skip
  if(endsWith(player, " ")){
    next
  }

  person = player_rankings %>% filter(Player == paste(player, " ", sep = ""))
  person2 = player_rankings %>% filter(Player == player)
  # get which one of person and person2 has non zero batting impact and choose that
  if(person$CareerBowlImpact[1] == 0 & person2$CareerBowlImpact[1] == 0){
    #find which bat impact isn't 0
    if(person$CareerBatImpact[1] != 0){
      player_rankings_2 = rbind(player_rankings_2, person)
      next
    }
    else{
      player_rankings_2 = rbind(player_rankings_2, person2)
      next
    }
  }
  if(person$CareerBatImpact[1] == 0){
    #only bowling records
    person$CareerBatImpact[1] = person2$CareerBatImpact[1]
    player_rankings_2 = rbind(player_rankings_2, person)
  }
  else if(person2$CareerBowlImpact[1] == 0){
    #only batting records
    person2$CareerBowlImpact[1] = person$CareerBowlImpact[1]
    player_rankings_2 = rbind(player_rankings_2, person2)
  }
  else if(person$CareerBowlImpact[1] == 0){
    #only batting records
    person$CareerBowlImpact[1] = person2$CareerBowlImpact[1]
    player_rankings_2 = rbind(player_rankings_2, person)
  }
  else if(person2$CareerBatImpact[1] == 0){
    #only bowling records
    person2$CareerBatImpact[1] = person$CareerBatImpact[1]
    player_rankings_2 = rbind(player_rankings_2, person2)
  }

}
Correct naming issue
2.2 Player Comparison and Visualization
Descriptive Stats and create player tables
player_rankings_2$TotalImpact = player_rankings_2$CareerBatImpact + player_rankings_2$CareerBowlImpact
player_rankings_2 = player_rankings_2 %>% arrange(desc(TotalImpact))
player_rankings_2$BatImpactperGame = player_rankings_2$CareerBatImpact / player_rankings_2$MatchesPlayed
player_rankings_2$BatImpactperGame_Z = (player_rankings_2$BatImpactperGame - mean(player_rankings_2$BatImpactperGame, na.rm = TRUE)) / sd(player_rankings_2$BatImpactperGame, na.rm = TRUE)
player_rankings_2$BowlImpactperGame = player_rankings_2$CareerBowlImpact / player_rankings_2$MatchesPlayed
player_rankings_2$BowlImpactperGame_Z = (player_rankings_2$BowlImpactperGame - mean(player_rankings_2$BowlImpactperGame, na.rm = TRUE)) / sd(player_rankings_2$BowlImpactperGame, na.rm = TRUE)
player_rankings_2$TotalImpactperGame = player_rankings_2$TotalImpact / player_rankings_2$MatchesPlayed
player_rankings_2$TotalImpactperGame_Z = player_rankings_2$BatImpactperGame_Z + player_rankings_2$BowlImpactperGame_Z
player_rankings_2 = player_rankings_2 %>% arrange(desc(MatchesPlayed)) #Model all matches
player_rankings_display = player_rankings_2 %>% filter(MatchesPlayed >= 20)
player_database = player_rankings_2 %>% filter(MatchesPlayed >= 5)
bowlimpactmedian = quantile(player_rankings_display$BowlImpactperGame, 5/11)
batimpactmedian = quantile(player_rankings_display$BatImpactperGame, 3.5/11)
player_rankings_display2 = player_rankings_display %>% dplyr::filter(BowlImpactperGame > bowlimpactmedian)
allrounderranking = player_rankings_display2 %>% dplyr::filter(BatImpactperGame > batimpactmedian)
allrounderranking = allrounderranking %>% arrange(desc(TotalImpactperGame))
(player_rankings_display)
## # A tibble: 406 × 12
## # Groups: Player [406]
## Player Country CareerBatImpact CareerBowlImpact MatchesPlayed TotalImpact
## <chr> <chr> <dbl> <dbl> <int> <dbl>
## 1 "RG Sha… IND 600. -10.9 153 589.
## 2 "JC But… ENG 572. 0 132 572.
## 3 "Mahmud… BAN 247. 93.8 124 341.
## 4 "AU Ras… ENG -27.6 413. 122 385.
## 5 "DA Mil… RSA 382. 0 122 382.
## 6 "GJ Max… AUS 451. 97.0 120 548.
## 7 "V Kohl… IND 608. 4.38 119 612.
## 8 "Babar … PAK 530. 0 119 530.
## 9 "TG Sou… NZL 29.4 449. 119 478.
## 10 "IS Sod… NZL -23.1 400. 119 377.
## # ℹ 396 more rows
## # ℹ 6 more variables: BatImpactperGame <dbl>, BatImpactperGame_Z <dbl>,
## # BowlImpactperGame <dbl>, BowlImpactperGame_Z <dbl>,
## # TotalImpactperGame <dbl>, TotalImpactperGame_Z <dbl>Plot top 15 batsman by career bat impact
par(mfrow = c(1, 1)) # Set up the plotting area to have one plot

library(ggplot2)
top_batsmen <- player_rankings_display %>%
  arrange(desc(CareerBatImpact)) %>%
  head(15)
ggplot(top_batsmen, aes(x = reorder(Player, CareerBatImpact), y = CareerBatImpact, fill = Country)) +
  geom_bar(stat = "identity") +
  coord_flip() +
  labs(title = "Top 15 Batsmen by Career Batting Impact",
       x = "Player",
       y = "Career Batting Impact") +
  theme_minimal() +
  geom_text(aes(label = round(CareerBatImpact, 2)), hjust = 1.4, color = "black", size = 3) # Add labels for clarity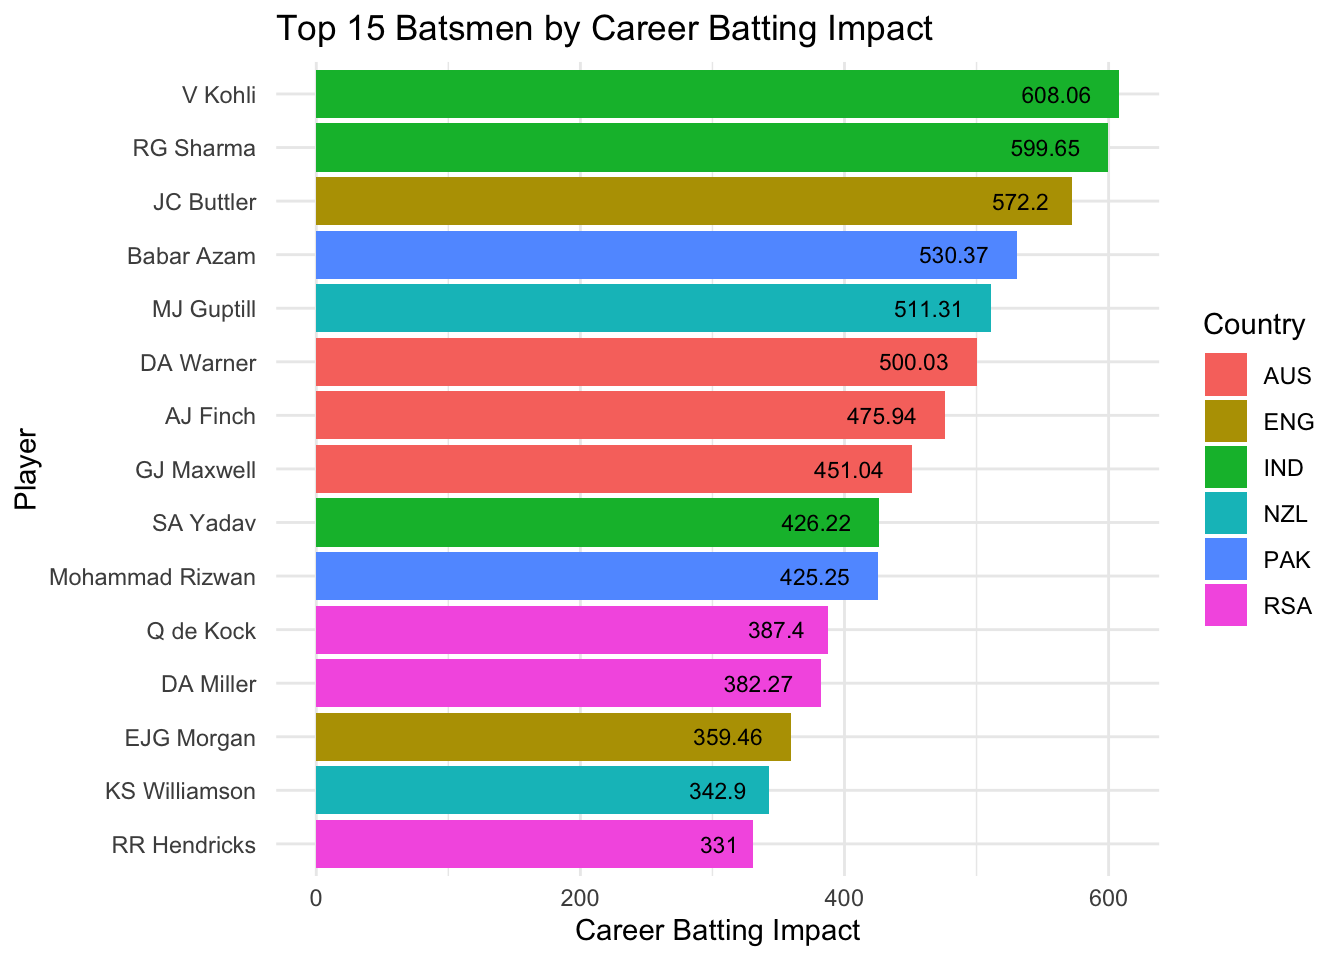
Plot top 15 bowlers by career bowl impact
top_bowlers <- player_rankings_display %>%
  arrange(desc(CareerBowlImpact)) %>%
  head(15)
ggplot(top_bowlers, aes(x = reorder(Player, CareerBowlImpact), y = CareerBowlImpact, fill = Country)) +
  geom_bar(stat = "identity") +
  coord_flip() +
  labs(title = "Top 15 Bowlers by Career Bowling Impact",
       x = "Player",
       y = "Career Bowling Impact") +
  theme_minimal() +
  geom_text(aes(label = round(CareerBowlImpact, 2)), hjust = 1.4, color = "black", size = 3) # Add labels for clarity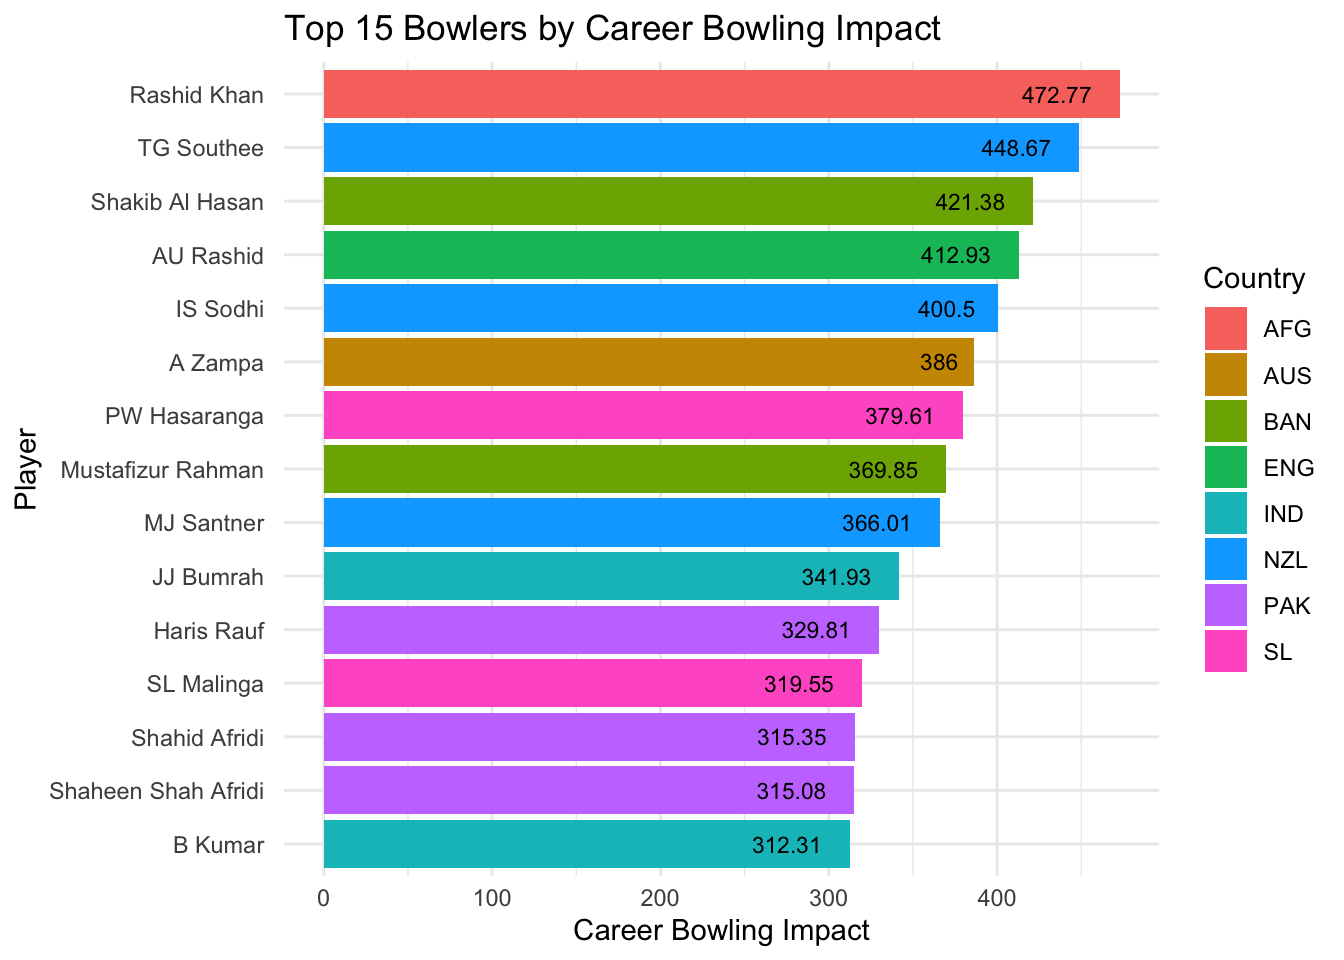
Plot top 15 all-rounders by total impact, partitioning the batting and bowling section
top_allrounders <- allrounderranking %>%
  arrange(desc(TotalImpact)) %>%
  head(15)
ggplot(top_allrounders, aes(x = reorder(Player, TotalImpact), y = TotalImpact, fill = Country)) +
  geom_bar(stat = "identity") +
  coord_flip() +
  labs(title = "Top 15 All-Rounders by Total Impact",
       x = "Player",
       y = "Total Impact") +
  theme_minimal() +
  geom_text(aes(label = round(TotalImpact, 2)), hjust = 1.4, color = "black", size = 3) # Add labels for clarity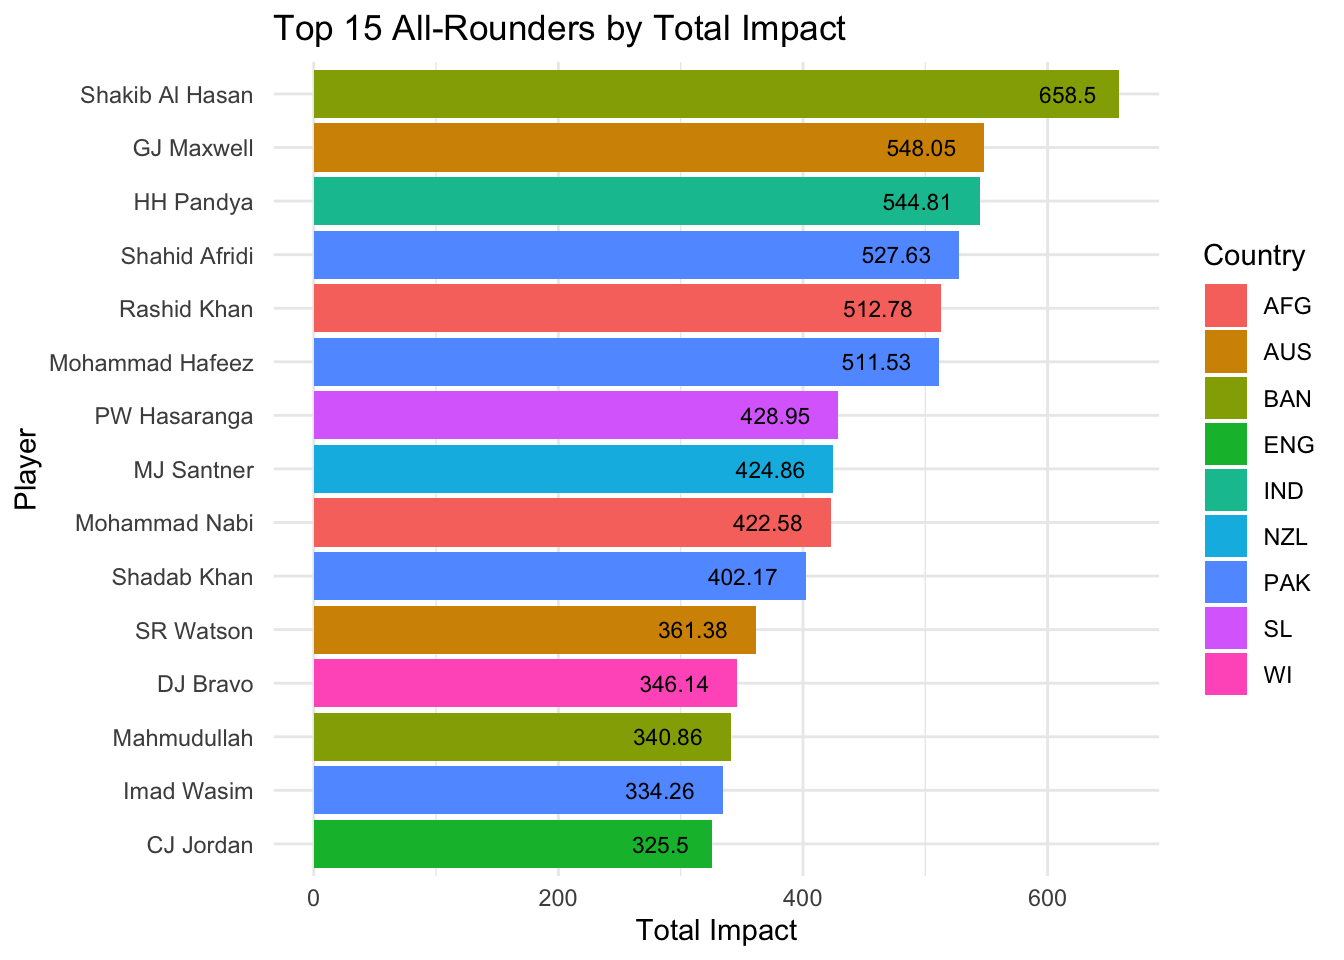
Plot top 15 all-rounders by Batting and Bowling Impact per Game
top_allrounders_per_game <- allrounderranking %>%
  arrange(desc(TotalImpactperGame)) %>%
  head(15)
ggplot(top_allrounders_per_game, aes(x = reorder(Player, TotalImpactperGame), y = TotalImpactperGame, fill = Country)) +
  geom_bar(stat = "identity") +
  coord_flip() +
  labs(title = "Top 15 All-Rounders by Total Impact per Game",
       x = "Player",
       y = "Total Impact per Game") +
  theme_minimal() +
  geom_text(aes(label = round(TotalImpactperGame, 2)), hjust = 1.4, color = "black", size = 3) # Add labels for clarity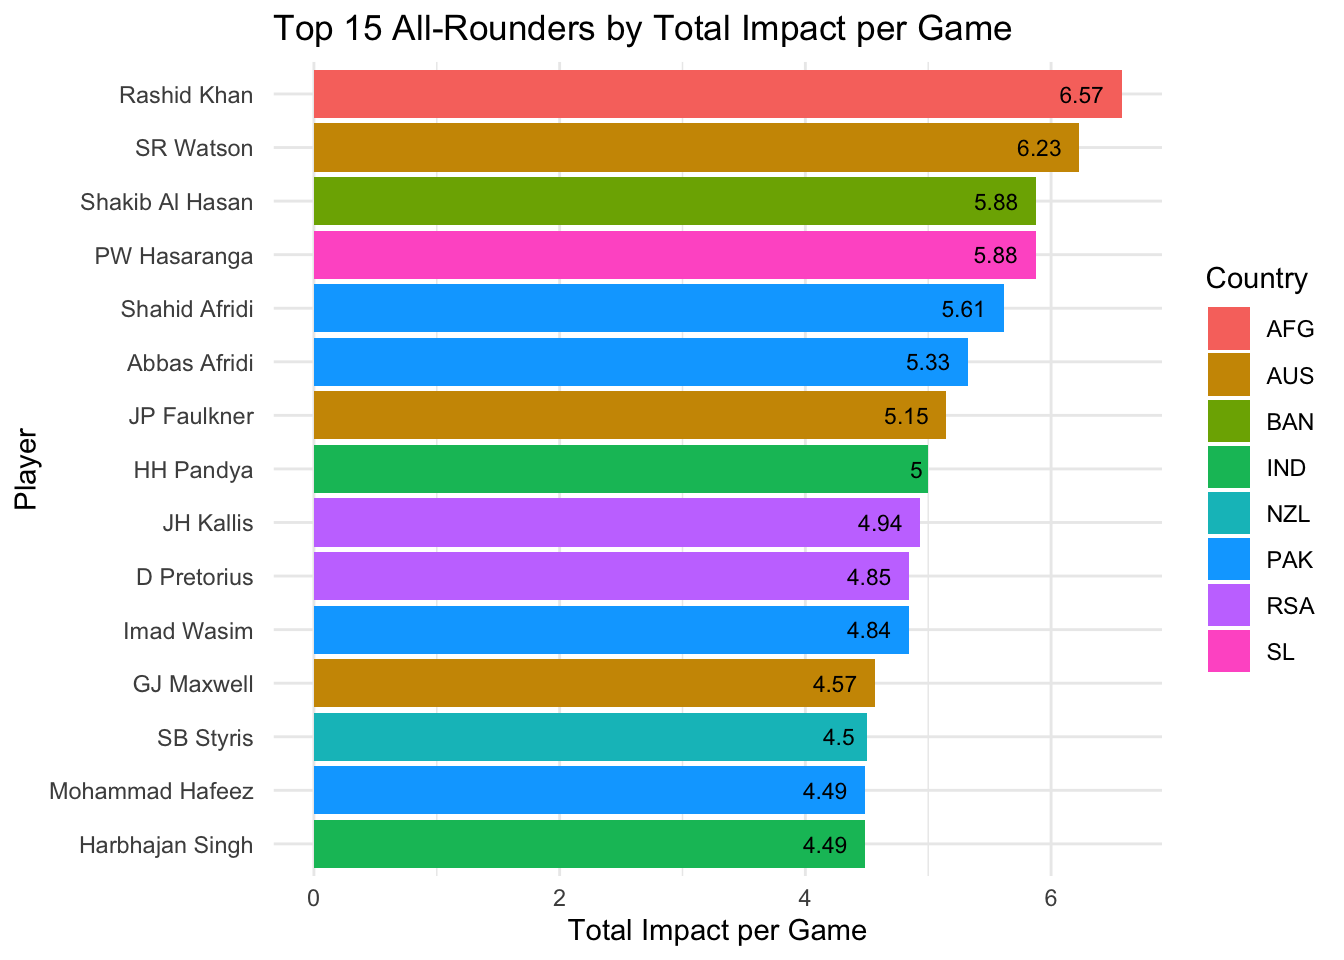
Plot top 15 Batsman by Batting Impact per Game
top_batsmen_per_game <- player_rankings_display %>%
  arrange(desc(BatImpactperGame)) %>%
  head(15)
ggplot(top_batsmen_per_game, aes(x = reorder(Player, BatImpactperGame), y = BatImpactperGame, fill = Country)) +
  geom_bar(stat = "identity") +
  coord_flip() +
  labs(title = "Top 15 Batsmen by Batting Impact per Game",
       x = "Player",
       y = "Batting Impact per Game") +
  theme_minimal() +
  geom_text(aes(label = round(BatImpactperGame, 2)), hjust = 1.4, color = "black", size = 3) # Add labels for clarity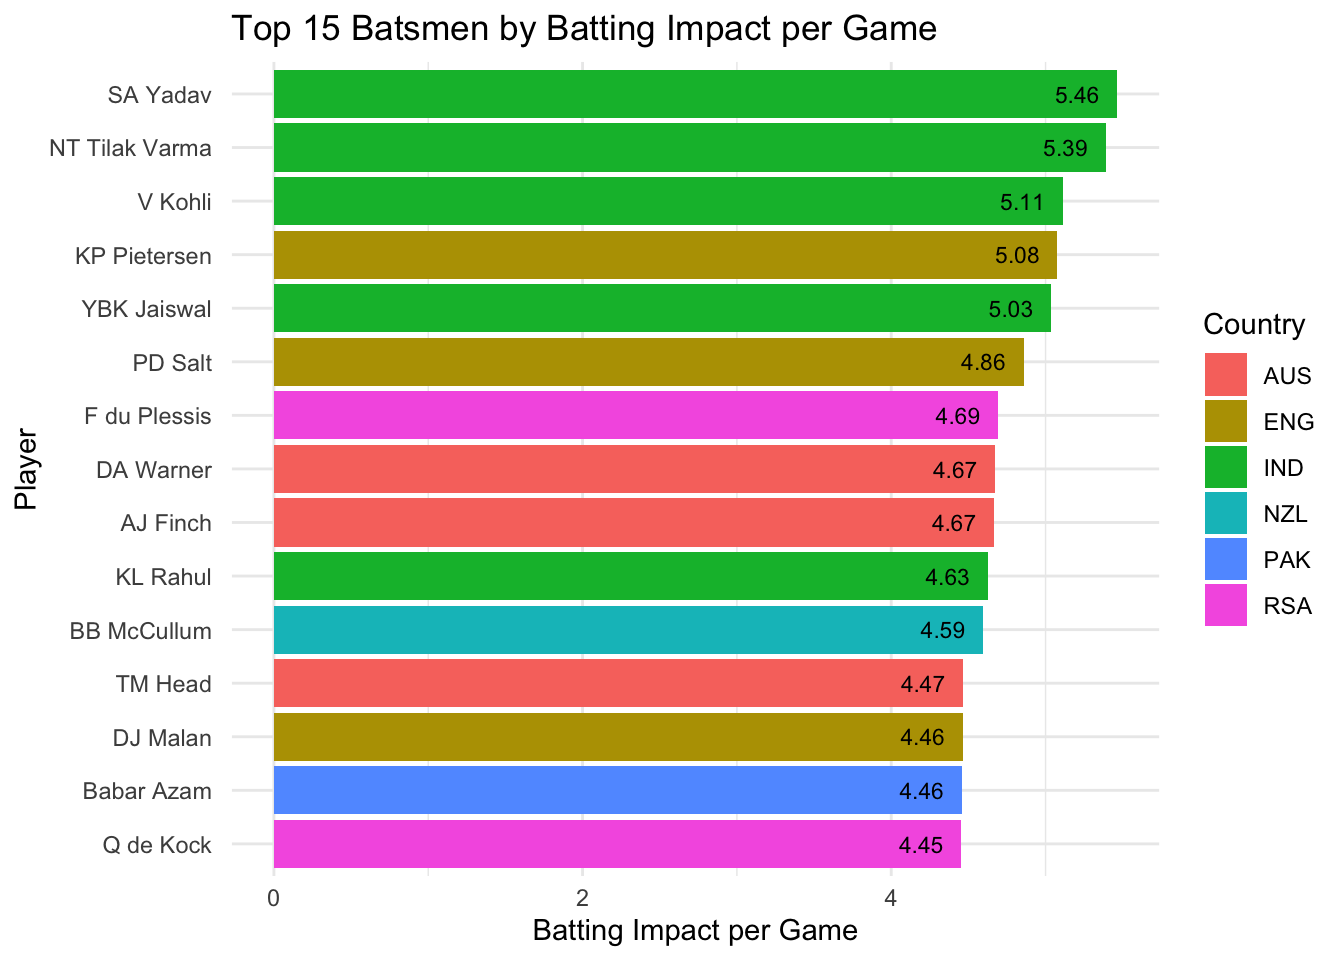
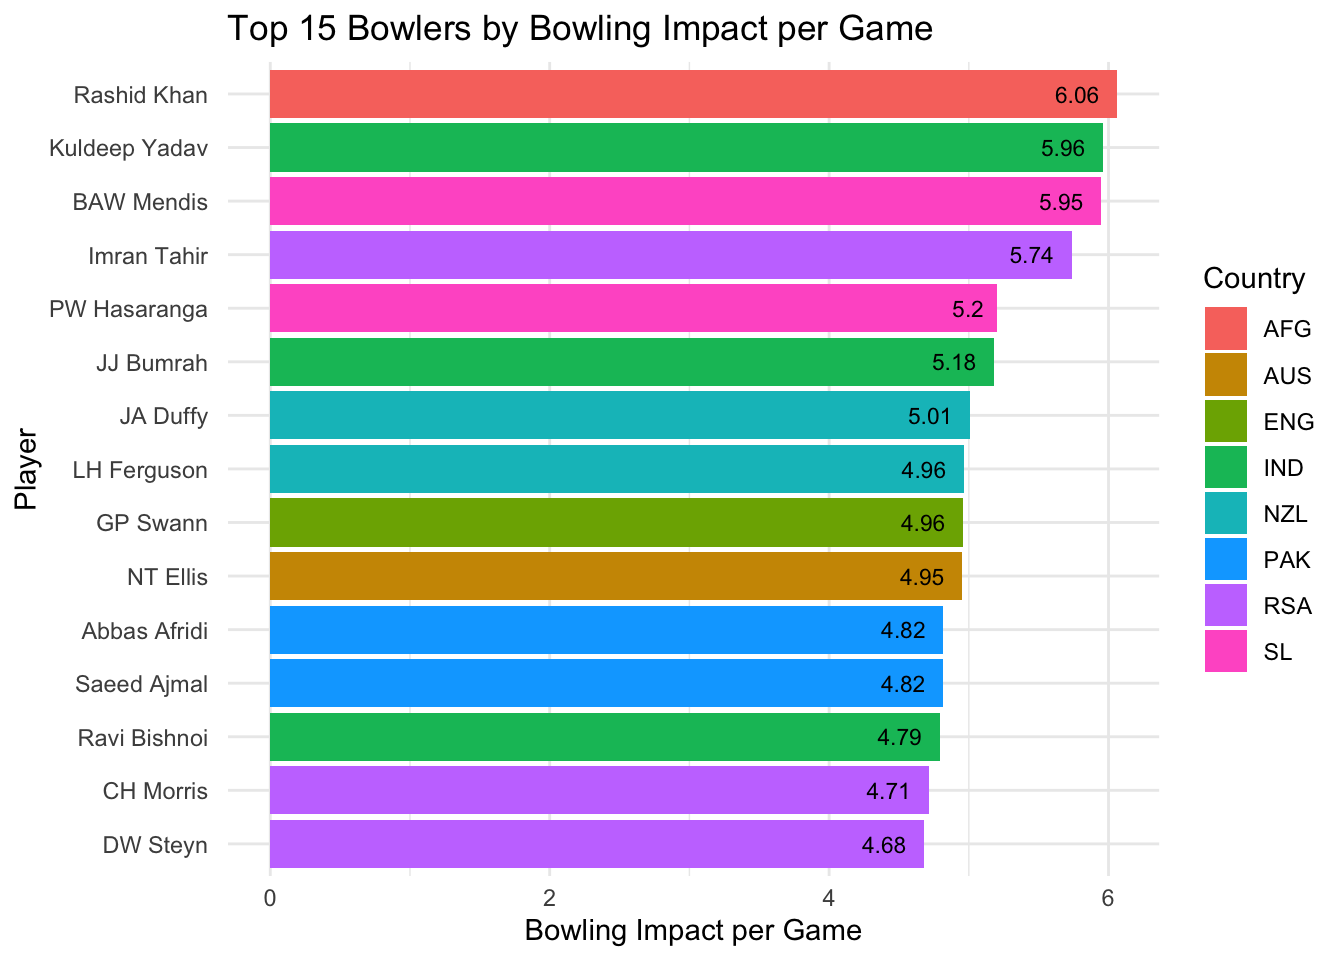
Plot top 15 Bowlers by Bowling Impact per Game
top_bowlers_per_game <- player_rankings_display %>%
  arrange(desc(BowlImpactperGame)) %>%
  head(15)
ggplot(top_bowlers_per_game, aes(x = reorder(Player, BowlImpactperGame), y = BowlImpactperGame, fill = Country)) +
  geom_bar(stat = "identity") +
  coord_flip() +
  labs(title = "Top 15 Bowlers by Bowling Impact per Game",
       x = "Player",
       y = "Bowling Impact per Game") +
  theme_minimal() +
  geom_text(aes(label = round(BowlImpactperGame, 2)), hjust = 1.4, color = "black", size = 3) # Add labels for clarity